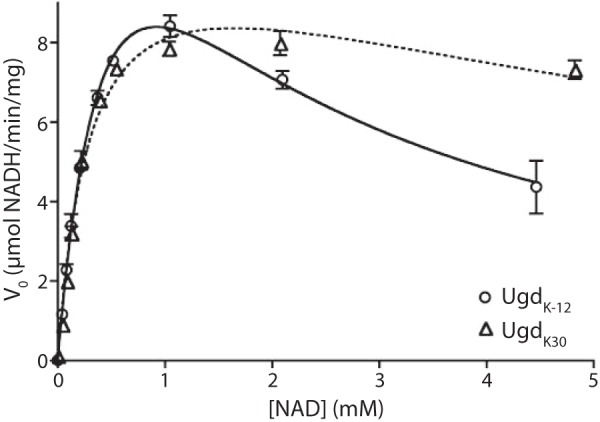
FIGURE 3.

NAD kinetics for UgdK-12 and UgdK30. The initial reaction velocities of UgdK-12 and UgdK30 were calculated over a range of NAD concentrations at a fixed UDPG concentration (5 mm). Lines representing the best fit of substrate inhibition kinetics were plotted for both homologs. Error bars represent the standard deviation of reactions done in triplicate.
