FIGURE 2.
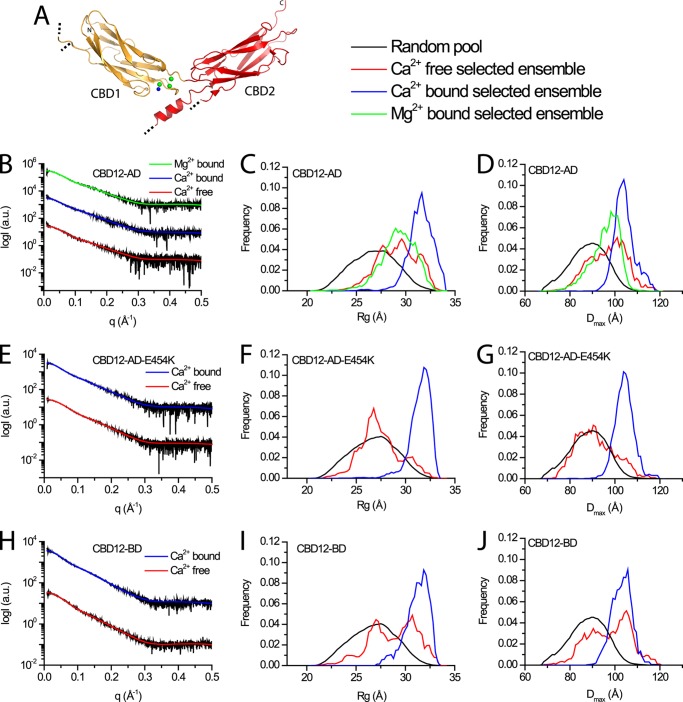
EOM analysis of NCX-CBD12 proteins. A, crystal structure of CBD12-E454K (PDB 3US9). CBD1 and CBD2 are colored orange and red, respectively. Green and blue spheres depict Ca2+ ions and water molecules, respectively. Dotted black lines denote chain breaks in the model due to poor electron density. B, E, and H, experimental SAXS curves and EOM fits for CBD12-AD, CBD12-AD-E454K, and CBD12-BD, respectively. C, F, and I, random Rg pools and EOM-selected ensemble distributions for CBD12-AD, CBD12-AD-E454K, and CBD12-BD, respectively. D, G, and J, random Dmax pools and EOM-selected ensemble distributions for CBD12-AD, CBD12-AD-E454K, and CBD12-BD, respectively.

