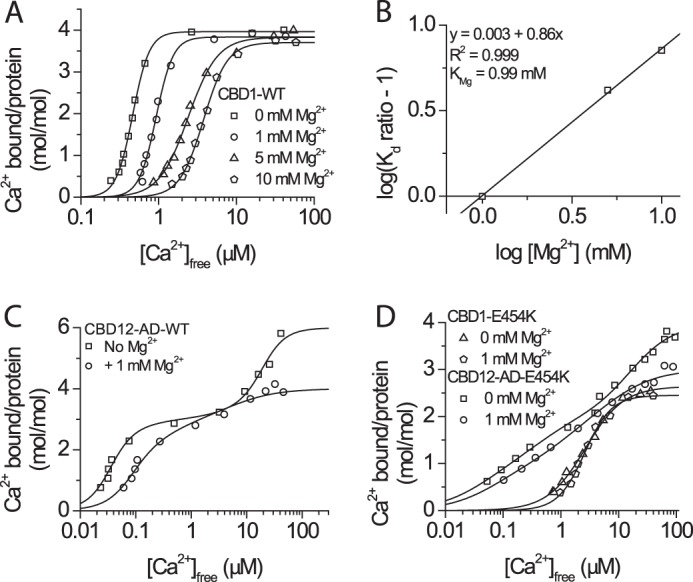
FIGURE 4.

Effect of Mg2+ interaction with isolated CBD1 and CBD12 proteins. A, 45Ca2+ titration curves of CBD1 in the presence of 0, 1, 5, and 10 mm MgCl2, as indicated. B, Schild plot analysis of the CBD1 KMg (Kd for Mg2+). C, 45Ca2+ titration curves of CBD12-AD in the absence and presence of 1 mm MgCl2 showing agreement with the effects observed for CBD1. D, 45Ca2+ titration curves of CBD1-E454K and CBD12-E454K in the absence and presence of 1 mm MgCl2, as indicated.
