FIGURE 3.

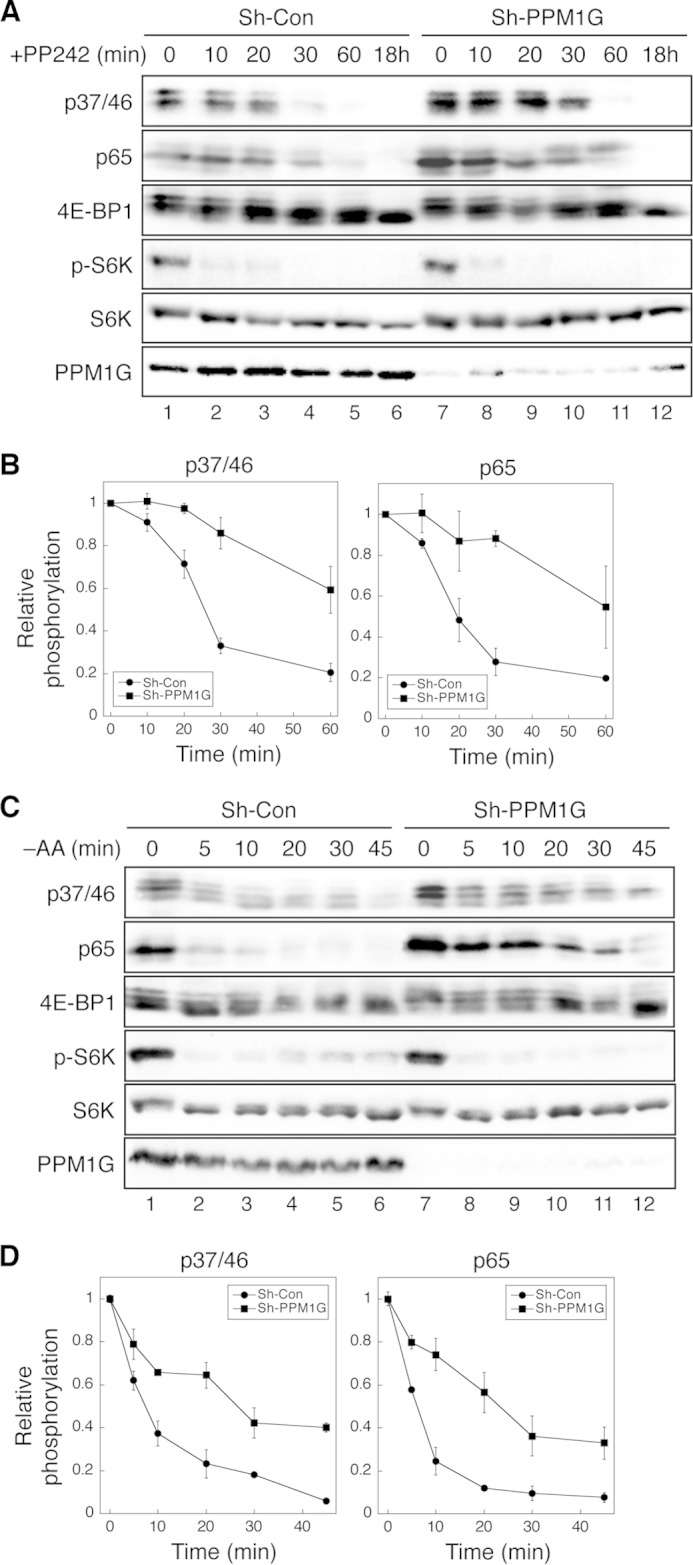
Knockdown of PPM1G delays the dephosphorylation of 4E-BP1 induced by mTOR inhibition. A, the time course of 4E-BP1 dephosphorylation upon inhibition of mTOR kinase activity. Stable control (Sh-Con) and PPM1G knockdown (Sh-PPM1G) HCT116 cells were treated with PP242 (100 nm) for 0–60 min or 18 h. Cell lysates were analyzed using immunoblotting. The phosphorylation of 4E-BP1 at Thr-37/46 and Ser-65 and p70S6K at Thr-398 was detected using phosphospecific antibodies. B, Western blot analyses as shown in A were quantified, the relative phosphorylation of 4E-BP1 was obtained by normalizing ECL signals generated by the p37/46 or p65 antibody to that of total 4E-BP1, and the quantitative results were expressed graphically. Data shown in the graph represent mean ± S.D. (n = 3). C, time course of 4E-BP1 dephosphorylation upon amino acid starvation (−AA). Stable control and PPM1G knockdown 293E cells were incubated in amino acid-free medium for 0–45 min. Cell lysates were analyzed using immunoblotting. The phosphorylation of 4E-BP1 at Thr-37/46 and Ser-65 and p70S6K at Thr-398 was detected using phosphospecific antibodies. D, Western blot analyses as shown in C were quantified, the relative phosphorylation of 4E-BP1 was obtained by normalizing ECL signals generated by the p37/46 or p65 antibody to that of total 4E-BP1, and the quantitative results were expressed graphically. Data shown in the graph represent mean ± S.D. (n = 3).
