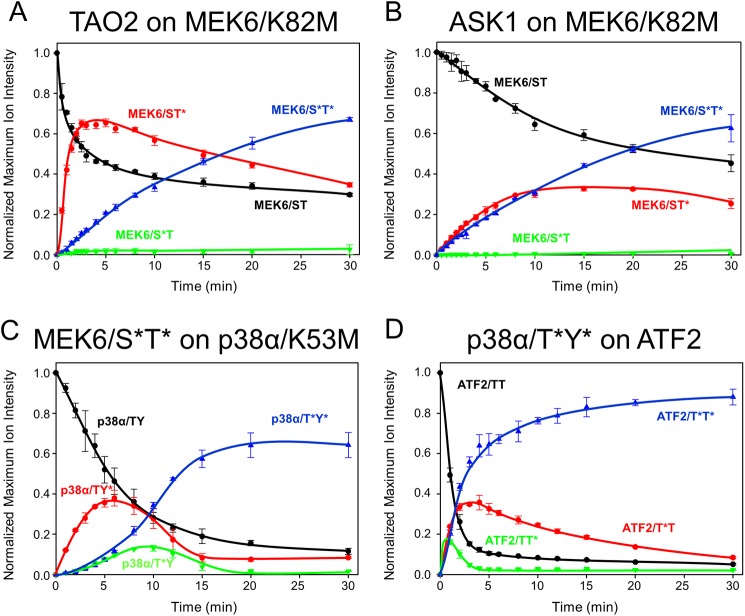
FIGURE 3.
Phosphorylation progress curves in the p38 cascade. A–D, time courses show MEK6/K82M phosphorylation by TAO2 (A) and ASK1 (B), p38α/K53M phosphorylation by MEK6/S*T* (C), and GST-ATF2 phosphorylation by p38α/T*Y* (D). Traces represent total ion current normalized selected ion response curves for each proteolytically derived activation loop phosphopeptide. Experiments were performed in triplicate with the error bars representing one standard deviation. Unphosphorylated (black), monophosphorylated (red and green), and doubly phosphorylated (blue) activation loop peptides were tracked for 30 min. In A and B, the sum of peptide signal apparently exceeds the starting value, probably due to errors in the total ion current normalization (38) and matrix ionization effects (55). In C and D, these effects were minimal.

