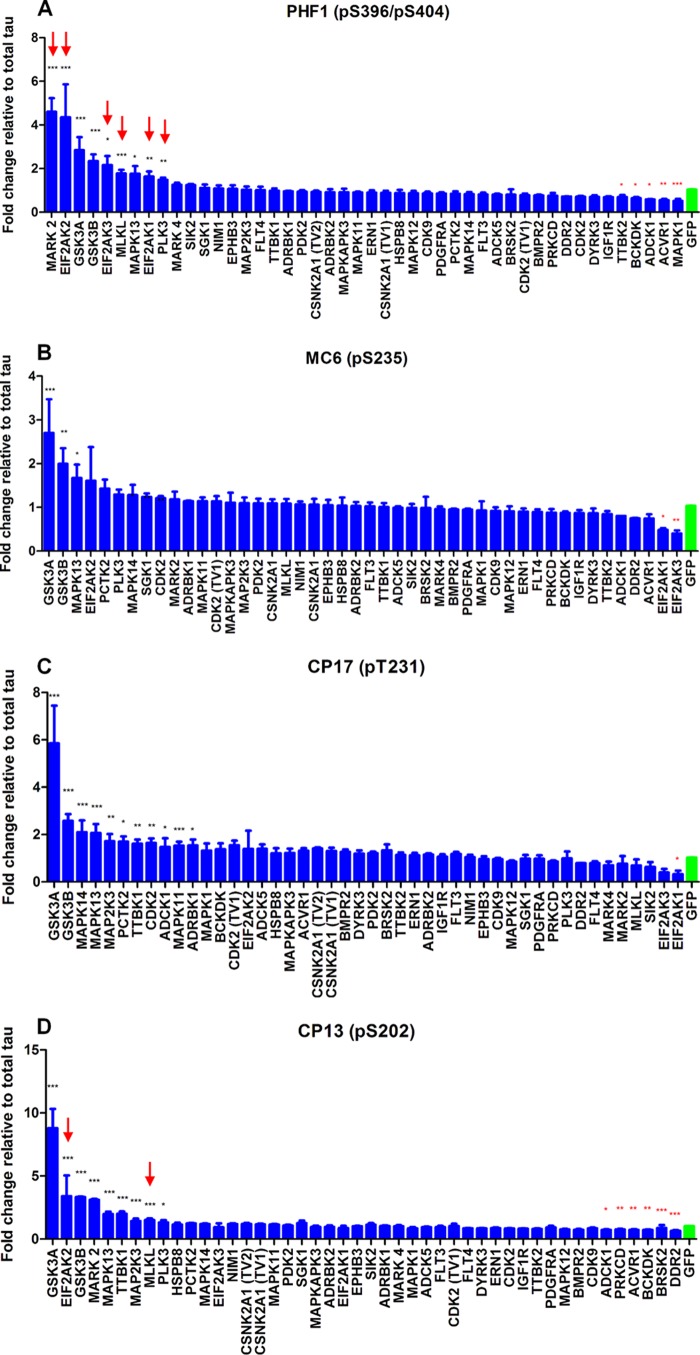
FIGURE 2.
Summary of screening data at each epitope: Ser(P)-396 (A), Ser(P)-235 (B), Thr(P)-231 (C), and Ser(P)-202 (D). 41 kinases from the first round (shown in Table 1) together with NIM1, SIK2, MAPK11, TTBK1, and TTBK2 were rescreened. The effect of these kinases and GFP on the phosphorylation levels of Ser(P)-202, Ser(P)-235, Ser(P)-396, and Thr(P)-231 was measured using phosphoepitope-specific AlphaScreen assays. The phospho-tau levels were normalized to total tau levels. The average of three separate transfections is shown. Statistical analysis was performed using a one-way ANOVA test with Dunnett's multiple comparison test on log -fold change values (*, **, and ***, p < 0.05, 0.01, and 0.001 versus GFP). Error bars represent S.E. Red arrows represent kinases that significantly reduced total tau levels.

