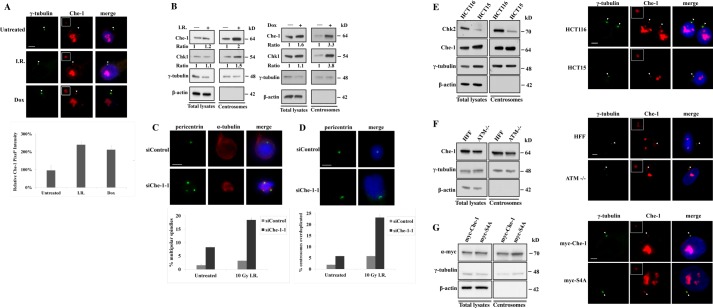
FIGURE 3.
Che-1 accumulates at centrosomes in response to DNA damage. A, HCT116 cells were treated with 10 grays of I.R. or with 1 μm Dox. Top, cells were stained with antibodies to Che-1 (red) and to γ-tubulin (green) for identification of centrosomes. Bottom, quantification of pixel intensity profiles constructed from fluorescence images of HCT116 cells untreated or treated with 10 grays of I.R. or with 1 μm Dox, using ImageJ software (National Institutes of Health, Bethesda, MD). B, isolated centrosomes or whole cell lysates from HCT116 cells treated as in A were subjected to immunoblotting with the indicated antibodies. C and D, HCT116 cells were transiently transfected with GFP siRNA (siControl) or Che-1 siRNA (siChe-1-1) and treated with 10 grays of I.R. Cells were stained with the indicated antibodies. Nuclei were visualized by staining with Hoechst dye 33258. Bar diagrams show the percentage of cells containing multipolar spindles or more than two centrosomes. In diagrams, gray bars indicate siControl transfected cells, and black bars indicate siChe-1-1-depleted cells. Error bars represent the S.D. after combining the results of three different experiments. Scale bar represents 5 μm. Arrowheads point to centrosomes, which are shown enlarged in insets. E and F, isolated centrosomes or whole cell lysates from HCT116 and HCT15 (Chk2-deficient) cells (E) or from normal Human and ATM−/− human fibroblasts (F) were subjected to immunoblotting with the indicated antibodies (left). Cells were immunostained with the indicated antibodies (right). G, left, isolated centrosome preparations or whole cell lysates from HCT116 transfected with Myc-Che-1 or Myc-S4A were analyzed by Western blot using the indicated antibodies. Right, cells were immunostained with antibodies to γ-tubulin (green) and Myc (red) antibodies. Nuclei were visualized by staining with 1 μg/ml Hoechst dye 33258. The scale bar represents 5 μm. Arrowheads point to centrosomes, which are shown enlarged in insets.

