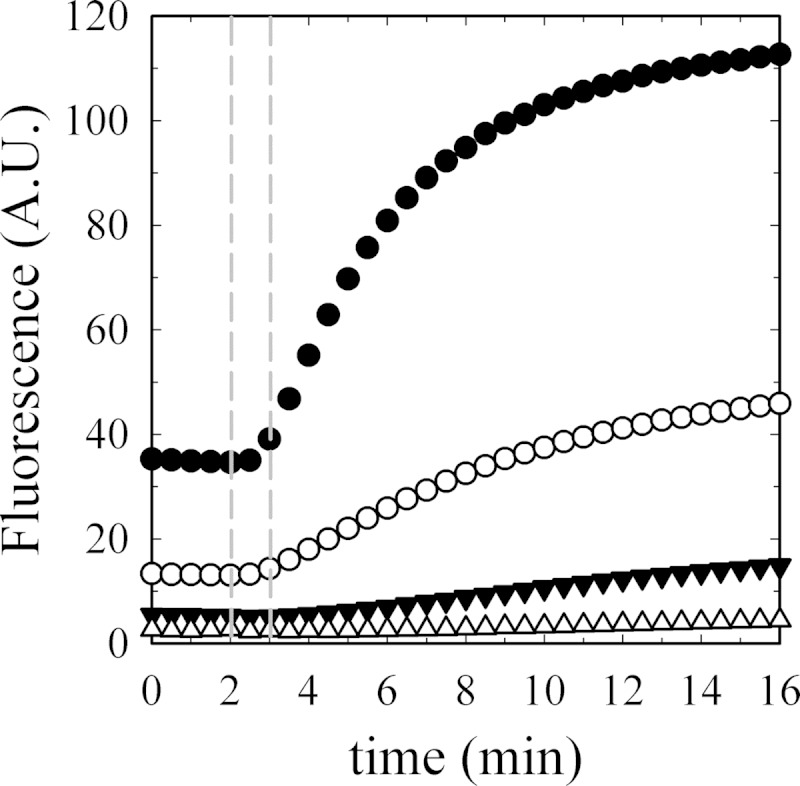
FIGURE 6.

Time course of actin polymerization in Ca2+-ATPase and EP experiments. Actin polymerization (6% pyrene-label) was measured as a function of G-actin concentration as follows: ●, 5.00; ○, 2.50; ▾, 1.25; and Δ, 0.62 μm final concentrations. The first 120 s show the base-line signals that are different for each actin concentration because the percentage of label is constant and therefore not the total amount. Polymerization was initiated as described under “Materials and Methods” at 120 s. Data were collected every 30 s. The range between the two vertical dashed lines shows the time window used to perform Ca2+-ATPase activity experiments and phosphoenzyme level determinations.
