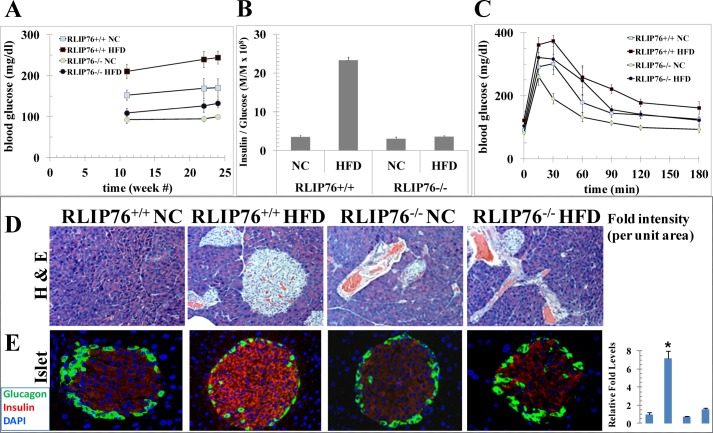
FIGURE 2.
Glucose tolerance test and pancreata staining in HFD-fed RLIP76+/+ and RLIP76−/− mice. Twenty-four (12 RLIP76+/+ and 12 RLIP76−/−) 12-week-old mice divided into four groups of 6 animals were used for this study. Twelve mice (6 RLIP76+/+ and 6 RLIP76−/−) were fed NC and the other 12 mice (6 RLIP76+/+ and 6 RLIP76−/−) a HFD for 12 weeks. Groups of 6 mice in each group also left on NC as well as HFD for 24 weeks for blood sugar level measurements. Blood sugar (panel A) as well as insulin and glucose measurements in serum were performed and data are presented as insulin-to-glucose ratio (panel B). For the glucose tolerance test experiment (panel C), mice were fasted for 16 h followed by intraperitoneal administration of 2 g/kg body wt of glucose. We collected a drop of blood from tail nick at 0, 15, 30, 60, 90, 120, and 180 min after glucose administration for measurement of the glucose level. We used silver nitrate sticks to stop bleeding from the tail nick at the end of blood sampling. A repeated measures of ANOVA of such data suggested the time, diet, and genotype effects are all very significant (p < 0.0001), which indicates that the blood glucose of a mouse will depend on the genotype, diet type, and the time it is measured. NC and HFD mice pancreas sections used for histopathologic analyses, represents H&E staining (panel D), and insulin (red) and glucagon (green) staining (panel E). Results shown are representative images from pancreas samples from each group. Percent staining was determined by measuring positive immunoreactivity per unit area. The intensity of antigen staining was quantified by digital image analysis using Image Pro plus 6.3 software (Media Cybernetics Inc., Bethesda, MD). Bars represent means with 95% confidence intervals (n = 6); *, p < 0.002, insulin staining, HFD compared with NC.

