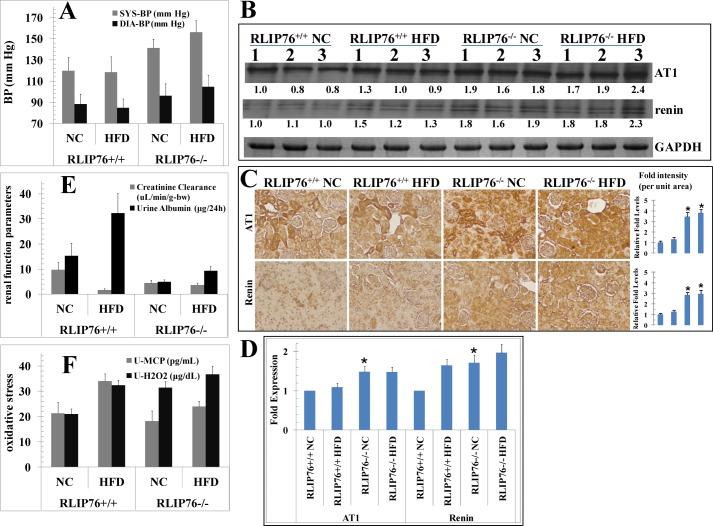
FIGURE 5.
Effect of HFD on blood pressure, urine, and hypertension markers, signaling proteins, and kidney cortex tissue staining. Blood pressure and pulse rate were measured by tail-cuff plethysmography (CODA2 Blood Pressure System; Kent Scientific, Torrington, CT) (panel A). Western blot analyses of AT1 and renin in kidney tissue lysates (used 40 μg of protein in each lane) in NC and HFD fed groups from RLIP76+/+ and RLIP76−/− mice. GAPDH was used as internal control. Numbers below the blots represent the fold-change in the levels of proteins as compared with wild-type NC-fed mice tissue (i.e. lanes 1–3, in each blot) as determined by densitometry. The blots are from three different mice tissues from each group as indicated (panel B). NC and HFD mice kidney sections were used for histopathologic analyses of AT1 and renin, showing significantly increased positive staining in RLIP76−/− mice without or with HFD as compared with RLIP76+/+ mice. Immunoreactivity is evident as a dark brown stain, whereas non-reactive areas display only the background color. Results shown are representative images from kidney samples from each group. Bars represent means with 95% confidence intervals (n = 6); asterisks denote statistically significant differences (p < 0.001) compared with RLIP76+/+ NC by two-sided Student's t test (panel C). Quantitative real-time PCR was performed with kidney cortex from all four groups, and each normalized against β-actin. Values are means with 95% confidence intervals (n = 4 in each group). All values were compared with RLIP76+/+ NC (*, p < 0.003) (panel D). Blood from the mice of each group was collected and the serum was separated and used for creatinine level. Urine from the mice of each group was collected and used for creatinine albumin (panel E), MCP-1, and H2O2 levels (panel F). NC and HFD mice kidney sections were used for histopathologic analyses. H&E staining, PAMS, Oil Red O, Masson's trichrome, collagen IV, nitrotyrosine, fibronectin, F4/80 (CD68), RAGE, CTGF, TGFβ, and pAMPK, showing increased positive staining in HFD RLIP76+/+ mice and its marked reduction in RLIP76−/− mice, except pAMPK. pAMPK expression was significantly reduced in HFD RLIP76+/+ mice and its marked induction in RLIP76−/− mice. Immunoreactivity is evident as a dark brown stain, whereas non-reactive areas display only the background color. Sections were counterstained with hematoxylin (blue). Percentage positive staining was reduced significantly in RLIP76−/− mice. Results shown are representative images from kidney samples from each group. Photomicrographs at ×40 magnification were acquired using Olympus DP 72 microscope and processed with DP2-BSW software. Percent staining was determined by measuring positive immunoreactivity per unit area. The intensity of antigen staining was quantified by digital image analysis using Image Pro plus 6.3 software. Bars represent means with 95% confidence intervals (n = 6); asterisks denote statistically significant differences (p < 0.001) compared with NC by two-sided Student's t test (panel G). Western blot analyses of signaling proteins (RLIP76, pAMPK (Thr172), pACC (Ser79), FAS, pP38-MAPK (Thr180/Tyr182), and pAKT (Ser473)) in kidney tissues lysates (used 40 μg of protein in each lane) in NC- and HFD-fed groups from RLIP76+/+ and RLIP76−/− mice. GAPDH was used as internal control. Numbers below the blots represent the fold-change in the levels of proteins as compared with wild-type NC-fed mice tissue (i.e. lanes 1–3, in each blot) as determined by densitometry using Alpha Imager HP. The blots are from three different mice tissues from each group as indicated (panel H).


