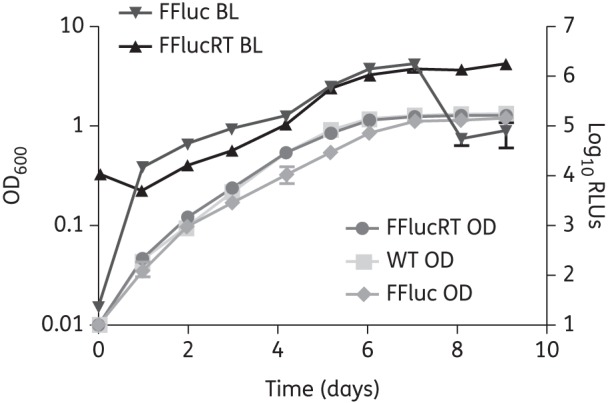
Figure 1.

FFlucRT bioluminescence correlates with cell density. Cultures of M. tuberculosis pMV306G13 + FFlucRT, M. tuberculosis pMV306G13 + FFluc and M. tuberculosis H37Rv (WT) were inoculated at an OD of 0.01, and the OD and luminescence were measured over 9 days. The plots represent the means and standard deviations of values for three independent cultures, and values are plotted on a logarithmic scale. BL, bioluminescence.
