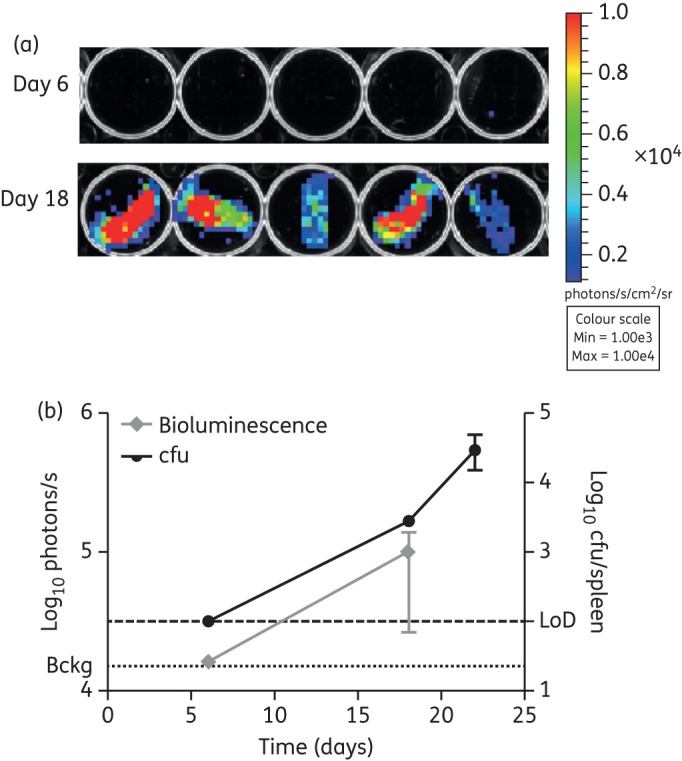
Figure 5.

Ex vivo bioluminescence in infected spleens. (a) Images of spleens harvested from the mice in Figure 3 infected with M. tuberculosis pMV306G13 + FFlucRT were acquired using an IVIS® Spectrum system at multiple timepoints following infection. (b) Bioluminescence (measured as photons/s) was quantified for each spleen and compared with cfu data at corresponding timepoints. Each point on the graph represents the median and range (n = 4–5 mice). Bckg, background luminescence (1.3 × 10⁴ photons/s); LoD, limit of detection (100 cfu). This figure appears in colour in the online version of JAC and in black and white in the printed version of JAC.
