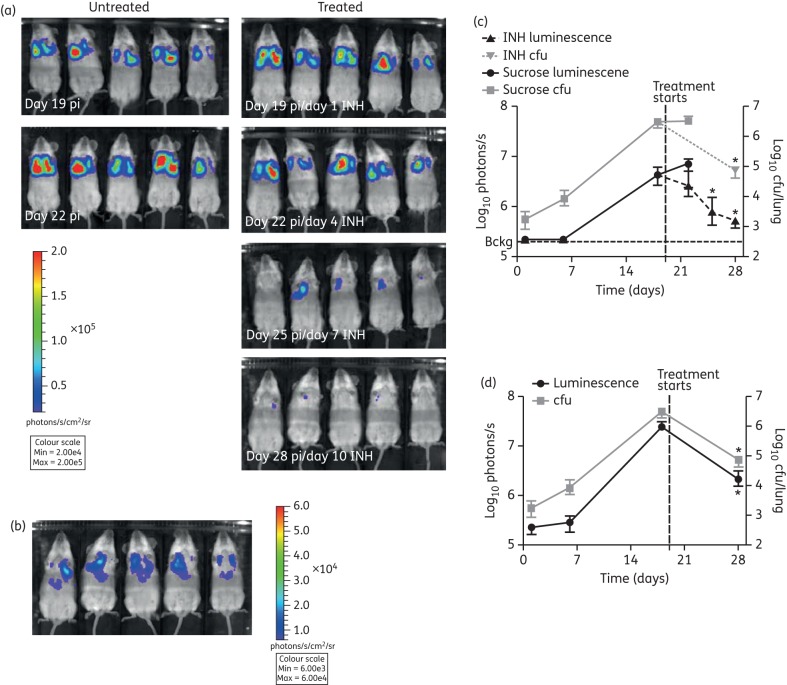
Figure 6.
Effects of drug treatment were detected non-invasively in live mice by bioluminescent imaging. M. tuberculosis pMV306G13 + FFlucRT-infected SCID mice were treated daily with 25 mg/kg isoniazid (INH) by oral gavage from day 19 post-infection (pi). A control group was treated with sucrose. (a) To visualize the effect of INH treatment, mice were injected intraperitoneally with 500 mg/kg d-luciferin, and images were acquired using an IVIS® Spectrum system. (b) The scale on the images shown here has been adjusted to demonstrate that a detectable signal was observed in the lungs of all five mice on day 28 post-infection, when the bacterial load was just 7.5 × 10⁴ cfu/lung. The mice are the same mice as shown in (a). The reduction in bacterial burden quantified in live mice (c) or lungs ex vivo (d) by bioluminescent imaging was confirmed by enumerating lung cfu. Each point on the graphs represents the median and range (n = 3–5 mice). Bckg, background luminescence in live mice (2 × 10⁵ photons/s). The background luminescence in the lungs ex vivo (1.5 × 10⁴ photons/s) is outside the axis limits. Statistical significance was evaluated by the Mann–Whitney test and those found to be significant (P < 0.05) are indicated with an asterisk. This figure appears in colour in the online version of JAC and in black and white in the printed version of JAC.

