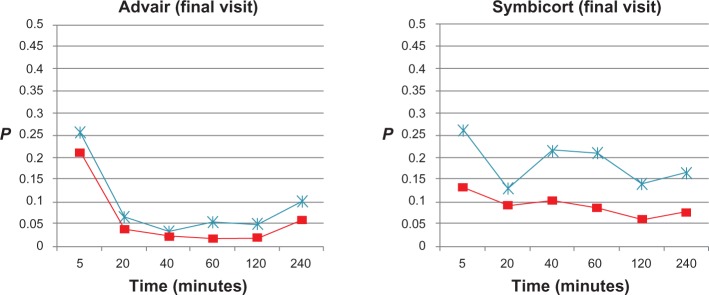
Figure 2.

t-test P-values of impulse oscillometry parameters (frequency-dependent resistance [R5–R20], * and reactance [AX], ■) at each time point after administration of Advair or Symbicort during final visits compared to the patients’ baseline R5–R20 and AX values (0.164 cmH2O/L/second and 1.171 cmH2O/L, respectively, for Advair; 0.127 cmH2O/L/second and 0.833 cmH2O/L, respectively, for Symbicort) during the same visit (n = 15 for each group).
