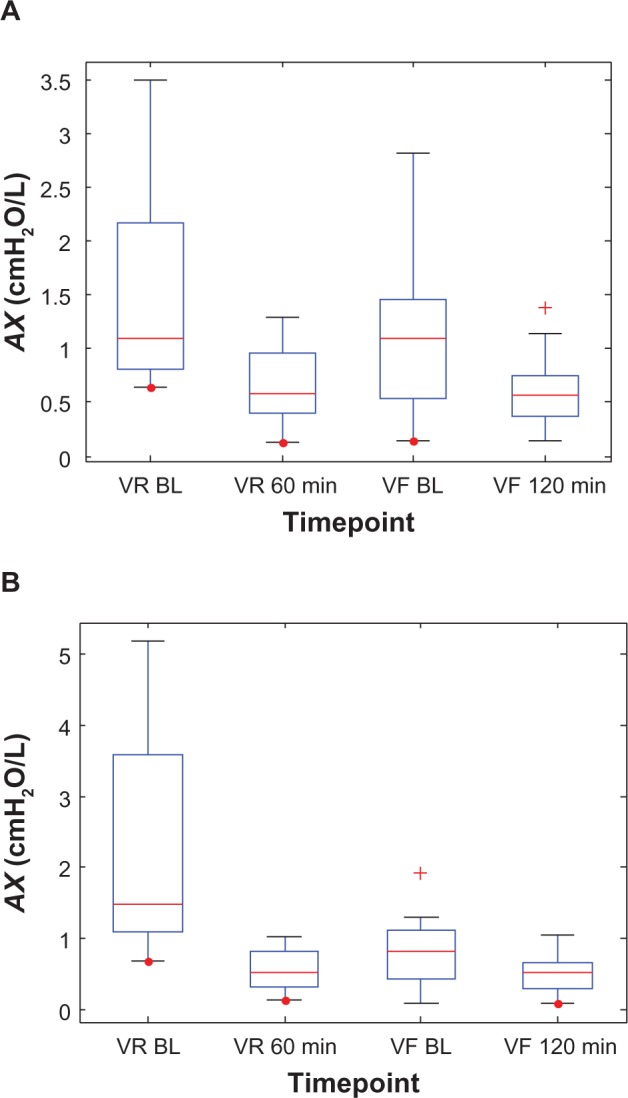
Figure 5.

Box plots of the individual impulse oscillometry frequency-dependent reactance (AX) values at two time points each during the randomization visits (VR) and the final visits (VF) for (A) the Advair group and (B) the Symbicort group.(/p)(p)Abbreviation: BL, baseline.
