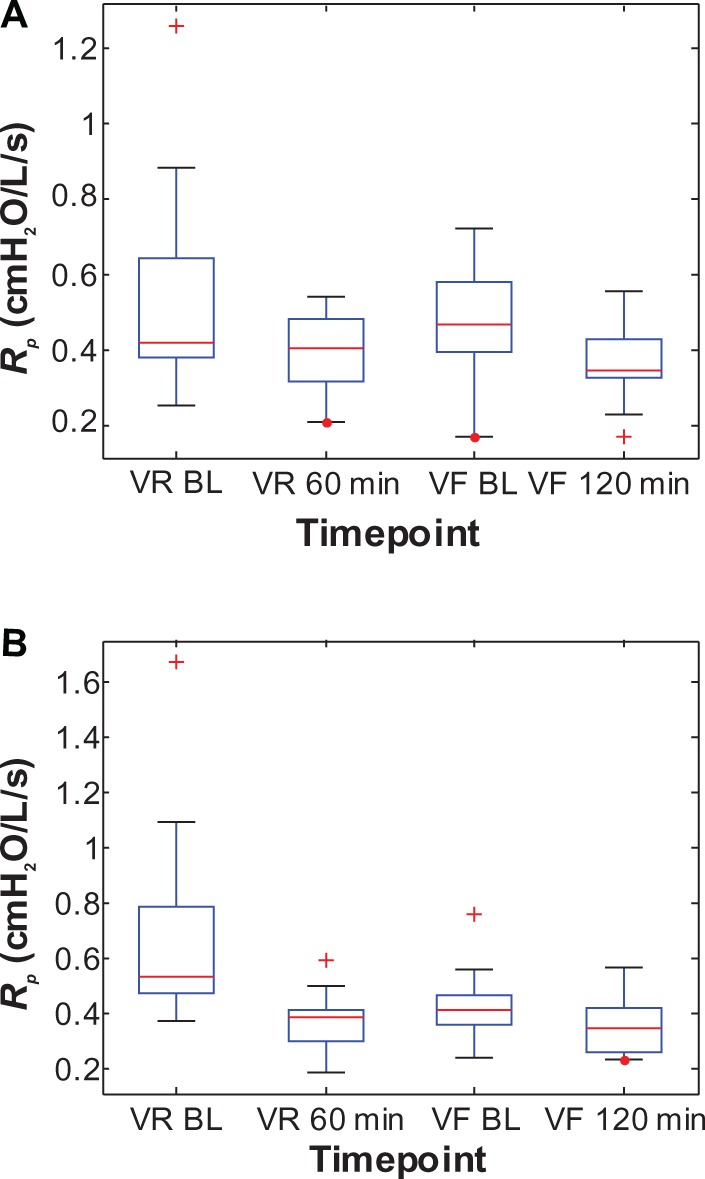
Figure 8.

Box plots of the individual peripheral airway resistance (Rp) values at two time points each during the randomization visits (VR) and the final visits (VF) for (A) the Advair group and (B) the Symbicort group.(/p)(p)Abbreviation: BL, baseline.
