Abstract
High–valent copper nitrene intermediates have long been proposed to play a role in copper catalyzed aziridination and amination reactions. However, such intermediates have eluded detection for decades, which prevents the unambiguous assignments of mechanisms. Moreover, the electronic structure of the proposed copper–nitrene intermediates has also been controversially discussed in the literature. These mechanistic questions and controversy have provided tremendous motivation for probing the accessibility and reactivity of CuIII–NR/CuIIN•R species. In this paper we report a breakthrough in this field by trapping a transient copper–tosylnitrene species 3–Sc in presence of scandium triflate. Sufficient stability of 3–Sc at −90 °C enabled its characterization with optical, resonance Raman, nuclear magnetic resonance, and x–ray absorption near edge (XANES) spectroscopies, which helped to establish its electronic structure as CuIIN•Ts (Ts = tosyl group) and not CuIIINTs. 3–Sc can initiate tosyl–amination of cyclohexane, thereby suggesting CuIIN•Ts cores as viable reactants in oxidation catalysis.
Terminal copper–nitrene units have been proposed as reactive intermediates in a number of copper catalyzed alkane amination and alkene aziridination reactions.1–4 Understanding the structures, properties, and reactivities of such species is critical for obtaining mechanistic insights into oxidation catalysis and for developing new, selective catalytic reagents and processes. Although, examples of isolated nitrenes of late transition metals such as Fe,5a Co,5b and Ni5c are known, direct spectroscopic characterizations of copper–nitrene intermediates have, however, not been reported leaving the mechanism ambiguous. Examples of such species have only been characterized through theoretical calculations.6 The nature of their ground state is also not unambiguous. The singlet (with a bent nitrene coordination mode) and the triplet (with linear nitrene coordination) states were theoretically calculated to be very close in energy, and the predicted ground state were found to depend strongly on the computational method used.6 We report herein the Lewis–acid trapping of an elusive copper–tosyl nitrene (CuII–N•Ts) species 3–Sc in presence of Sc(OTf)3 in near–quantitative yields, and its detailed characterization by spectroscopy and theory, which leads to an unambiguous assignment of its electronic structure. Moreover, complex 3–Sc comprising the CuII–N•Ts core rapidly abstracts hydrogen atoms from the strong C–H bonds of cyclohexane, thus providing a key precedent for the possible involvement of CuII–N•Ts in oxidation catalysis.
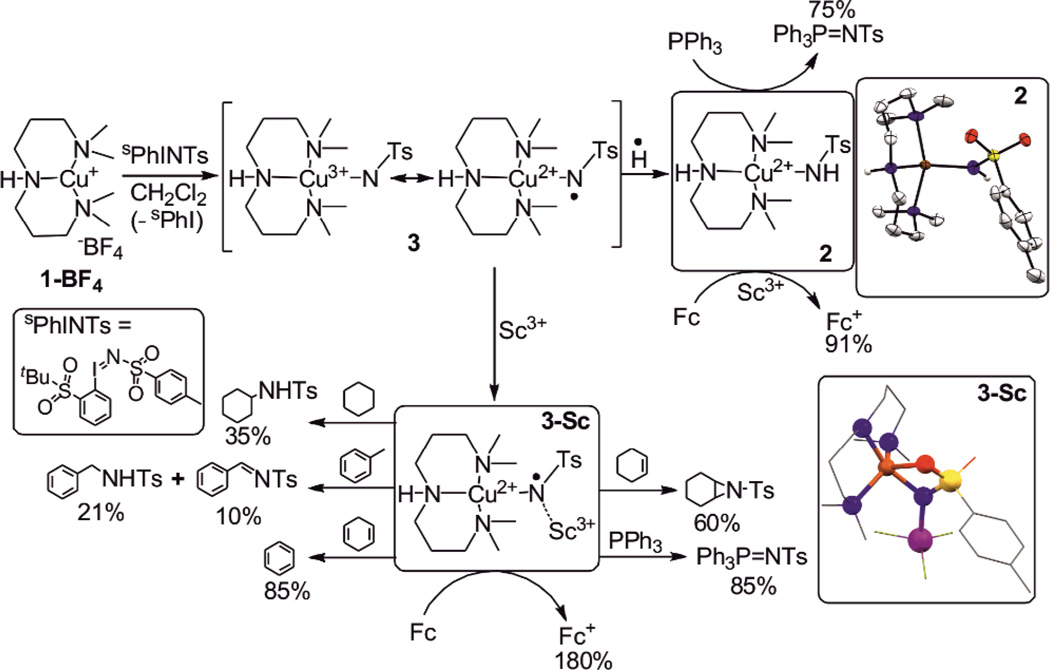
Reaction of the [Cu(L1)](BF4) (1–BF4) complex (L1 = 3,3’–iminobis(N,N–dimethylpropylamine))7 with two equivalents of [N–(p–toluenesulfonyl)imino](2–tert–butylsulfonyl)phenyliodinane (sPhINTs)8 at 25 °C resulted in the immediate formation of a bluish–green complex 2 (Scheme 1). Greenish-blue crystals suitable for X–ray diffraction (Table S1) were obtained by layering of hexane onto a dichloromethane solution of 2. The molecular structure of 2 determined by X–ray crystallography shows a four coordinate copper–tosylamide complex cation (Scheme 1) with the geometry of copper being best described as distorted tetrahedral. The Cu–Namide distance of 1.934(2) Å is comparable to that reported for other Cu(II)–sulfonamide complexes (1.921 (2) – 1.954 (7) Å).9 The absorption spectrum of 2 displays a low–intense broad band (λmax [εmax] = 660 [250 M−1cm−1] nm) extending from 550 nm to 1050 nm, which is assigned to the low–energy d–d transitions arising from a S = ½ d9 Cu(II) center in a pseudo–tetrahedral geometry (Figure 1 top; dash-dotted line). The X–band EPR spectrum (Figure S1) of the sample frozen to −196 °C after mixing 1–BF4 and sPhINTs at 25 °C shows a slightly rhombic signal with the g–values (gx=2.09, gy=2.07 and gz=2.27) and hyperfine constants (Ax=54×10−4 cm−1, Ay=15×10−4 cm−1 Az=128×10−4 cm−1) consistent with the d(x2–y2) ground–state of the Cu(II) center.10 Spin quantitation based on EPR signal indicates that at least 95% of the centers contain monomeric CuII species.
Scheme 1.
Formation and reactivity of 2 and 3–Sc. Color code: Sc: purple; N: blue; S: yellow; O: red; Cu: orange and C: grey.
Figure 1.
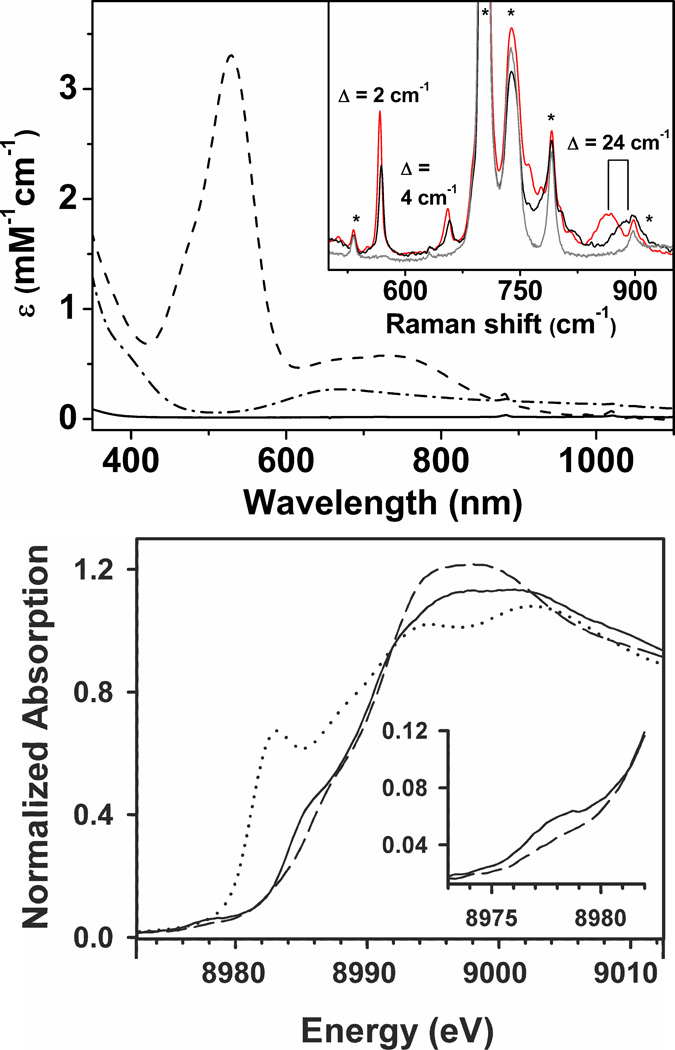
Top: Absorption Spectra of 1–BF4 (solid line), 2 (dash–dotted line), and 3–Sc (dashed line) in CH2Cl2 at −90 °C. Inset: rRaman spectra of 3–Sc–14N (black line), 3–Sc–15N (red line) and 3–Sc–decay product at RT (gray line) upon exciting at 514 nm. Bands originating from the solvent are marked by asterisk. Bottom: Normalized XANES spectra for 1–BF4 (dotted line), 2 (solid line), and 3–Sc (dashed line). The inset depicts an expansion of the pre–edge region for 2 and 3-Sc.
The conversion of 1–BF4 to 2 in presence of sPhINTs presumably involved the initial formation of a transient Cu–nitrene intermediate 3 followed by rapid hydrogen atom abstraction from the solvent and/or adventitious water (Scheme 1). We, therefore, sought to trap the elusive CuIII–NTs/CuII–N•Ts intermediate 3 before its conversion to 2 and demonstrate its reactivity in a number of group transfer reactions. Monitoring of the reaction of 1–BF4 with sPhINTs in CH2Cl2 by ultraviolet–visible spectroscopy in a range of temperatures from room temperature to −90 °C, however, did not lead to the accumulation or observation of any intermediate species competent for alkane or alkene substrate oxidation. A near–quantitative yield of the CuII species was obtained even at temperature as low as −90 °C. We then tried to trap 3 in presence of a Lewis–acid, a strategy which we successfully used previously to stabilize an elusive S=3/2 oxocobalt(IV) complex.11 Indeed, a metastable intense purple intermediate was obtained with absorption maxima λmax[εmax] centered at 530 [3500 M−1cm−1] nm and 750 [580 M−1cm−1] nm (Figure 1 top; dashed line) when 1 equivalent of Sc(OTf)3 was used in the reaction.12 Interestingly, the absorption feature at 530 nm of the new intermediate resembles that reported by Tolman and coworkers13 for the CuIII–OH complex and by King et al.14 for the corresponding aryl–Cu(III)–X (X= Cl, Br, I) complexes. Generation of the purple intermediate 3–Sc was found to be complete immediately upon adding the oxidant sPhINTs to a CH2Cl2 solution of 1–BF4 and Sc(OTf)3 at −90 °C, after which it slowly decayed to a Cu(I)15 species with a half–life (t1/2) of 1600 seconds (Figure S2). In contrast to the doublet (S=1/2) ground state of 2, 3–Sc is diamagnetic (S = 0) as demonstrated by the 1H–NMR resonances spread over a chemical shift range of 0 to +10 ppm (Figure S3).
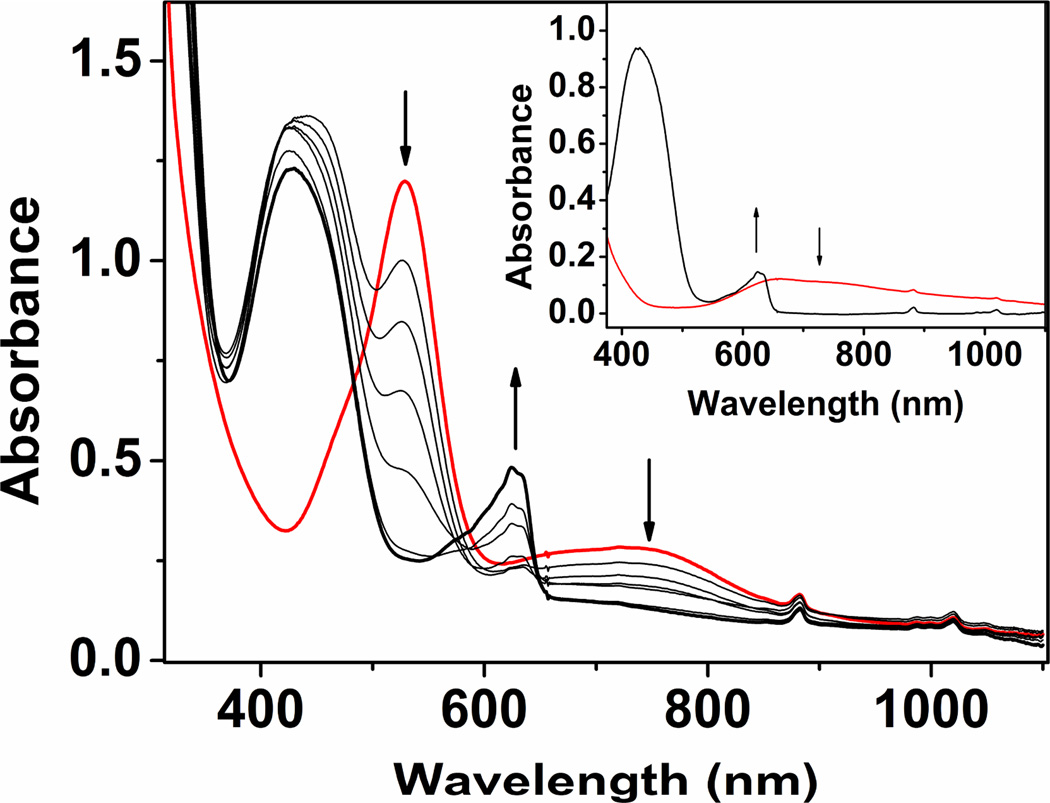
3–Sc underwent a two–electron reduction process with a one electron reductant like ferrocene (Fc) at −90 °C with the corresponding formation of Cu(I)15 and ferrocenium cation (Fc+; 180 % yield) (Figure 2); this confirmed that 3–Sc is two oxidation level above 1–BF4 and its initial yield is at least 90%. The two-electron reduction of 3-Sc in presence of Fc and also its decay to Cu(I) at elevated temperatures (>−90 °C) are in contrast to the spontaneous one-electron reduction of transient 3 to 2 in the absence of Sc3+ ion. This presumably results from a much stronger binding of the Sc3+ ion to the one-electron reduced form of 3, owing to the increased electron density on the tosylimido group. This would facilitate further reduction to a Cu(I) complex, accompanied by removal of the imido group with protons as tosylamide. Consistent with this explanation, an independently generated solution of 2 in CH2Cl2 was found to be inefficient in oxidizing Fc at −90 °C in the absence of Sc3+; in presence of Sc3+, however, 2 was reduced to a Cu(I) species with the corresponding formation of Fc+ in 90% yield (Figure 2 inset). A similar effect of Sc3+ ion was demonstrated previously by Fukuzumi et al.16 for the reduction of the [FeIV(O)(TMC)]2+ (TMC = 1,4,8,11-tetramethyl-1,4,8,11-tetraazacyclotetradecane) complex cation in presence of Fc.
Figure 2.
Changes in the absorption spectra associated with the reaction of 3–Sc (0.34 mM) with ferrocene (30 equiv.) at −90 °C. Inset: Absorption spectra of 2 (dotted line) (0.36 mM) and its reaction product (solid line) with ferrocene (30 equiv.) in presence of 1 equivalent of Sc(OTf)3 at −90 °C. The yield of the ferrocenium was determined on the basis of the known extinction coefficient (ε) of 620 nm band = 505 M−1cm−1 in CH2Cl2 at −90 °C.
Resonance Raman (rR) spectrum of 3–Sc using 514 nm laser excitation in resonance with the 530 nm transition (Figure 1 top, inset) displays three bands at 570, 660, and 887 cm−1 that can be attributed to the CuIII–NTs/CuII–N•Ts core on the basis of 15N–isotope labeling. The band at 887 cm−1 shows the largest 15N/14N downshift of 24 cm−1, whereas the other two bands at 570 and 660 cm−1 show a much weaker sensitivity to 15N labeling with downshifts of 2 and 4 cm−1, respectively. RR spectra thus establish the 530 nm band in 3–Sc as predominantly nitrene to Cu charge transfer in character due to the selective enhancement of modes involving Cu—NTs coordinates.
We then turned to X–ray absorption spectroscopy to directly probe the Cu oxidation state in 3–Sc. Complexes 1–BF4 and 2 exhibit XANES features characteristic of CuI and CuII, respectively, as expected (Figure 1 bottom).17 The edge features of 3–Sc are altered relative to 2, with a ca. 1 eV hypsochromic shift in energies of the two inflection points along the rising edge (Figure S4). However, while the intensity of the pre–edge feature weakens significantly in 3–Sc, its position at approximately 8978 eV is unchanged from that of 2 (Figure S5). Edge energies are known to be an ambiguous predictor for identifying whether a given complex is CuII or CuIII, reflecting the fact that the Cu edge includes 1s–to–4p transitions that are strongly influenced by donor ligands and geometric structure. Instead, the energy of the pre–edge feature associated with a 1s–to–3d transition provides the most reliable basis for identifying CuIII complexes, as this feature typically upshifts by 2 eV relative to CuII congeners.13,18 The absence of a hypsochromic shift in the pre–edge energy strongly suggests that 3–Sc contains a CuII center bound to a nitrene radical, consistent with a CuII–N•Ts formulation. The present study, therefore, adds to the very few extant reports in the literature, where direct evidence of metal–bound nitrene radicals has been observed.5a,b,19
Unfortunately, the strongly absorbing CH2Cl2 solvent prevented us from obtaining data of sufficient quality for an EXAFS analysis of 3–Sc. DFT calculations were, therefore, performed to gain insights into the molecular structure of 3–Sc. All calculations were done at the BP86/TZVP level in acetone (ε = 21), which could successfully reproduce the experimentally observed geometry, and in particular, the trends in variation of the metal nitrogen distances in 2 (Table S2–S3). The overestimation of the metal nitrogen distances in the calculated structure by 0.05 – 0.08 Å are typical of DFT functionals. The optimized structure of 3–Sc (Scheme 1, Table S4) in the experimentally observed singlet state reveals a bent copper–nitrene unit with a k2–N,O binding mode of the NSO2R tosylnitrene ligand consistent with the results of a previous calculation.6a The Cu–N(Sc)Ts distance in 3–Sc is calculated to be 0.045 Å shorter than the Cu–NHTs distance in 2 (Table S2). Three Raman–active bands were calculated involving the Cu–N(Sc)Ts core, whose positions and 15N/14N isotopic shifts are in reasonable agreement with experiments, thereby validating the proposed structure of 3–Sc (Figure S6 and vib.avi). Based on the calculation the experimentally observed rR band at 887 cm−1 (15N/14N –shift of 24 cm−1) is assigned to a symmetric bending of the N–Cu–S angle as shown in figure S6a; the calculated frequency is 882 cm−1 with a shift of 16 cm−1. The remaining 15N–sensitive rR bands at 660 cm−1 (15N/14N–shift of 4 cm−1) and at 570 cm−1 (15N/14N–shift of 2 cm−1), on the other hand, correspond to Cu–N stretching modes that are strongly coupled to the vibrations of tosyl as well as of the scandium moiety; the calculated frequencies are at 654 cm−1 (15N/14N of 3 cm−1; Figure S6b) and 589 cm−1 (15N–shift of 1 cm−1; Figure S6c), respectively. The slight underestimation (by 1–8 cm−1) of the calculated 15N/14N-shifts implies that DFT predicts a slightly different mode composition.
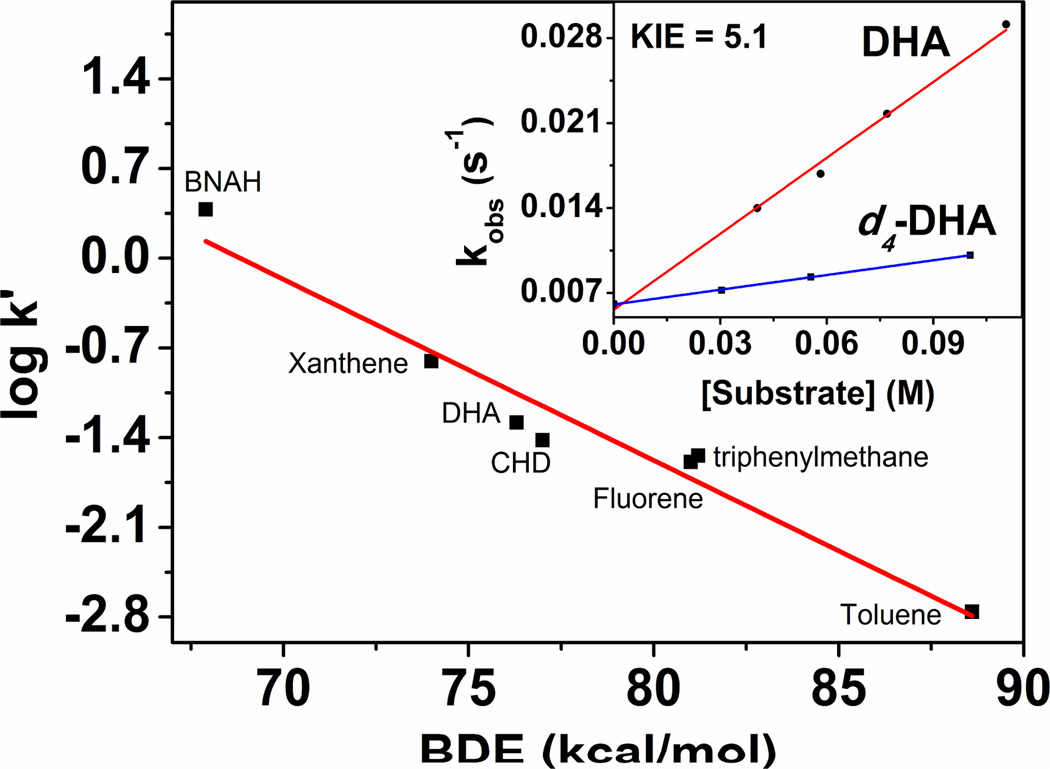
The oxidative reactivity of 3–Sc was examined for the oxidation of hydrocarbons with C–H bond dissociation energies20 (BDE) of 67.9–99.5 kcal mol−1. Product analysis of the reaction solutions revealed the formation of the amination or dehydrogenation products in 85 – 35 % yields (Scheme 1, Table S5); the yields decreased with increasing C–H bond strength. The kinetics of the reaction could be followed by UV–Vis studies (Figure S7–S9) at −90 °C, when 1–Benzyl–1,4–dihydronicotinamide (BNAH), xanthene, dihydroanthracene (DHA), 1,4–cyclohexadiene (CHD), triphenylmethane, fluorene and toluene were used as substrates. The rates of the reactions were found to be linearly correlated with the BDEs of the substrates (Figure 3), thereby revealing a rate–determining H–atom abstraction process. Furthermore, a deuterium kinetic isotope effect (KIE) of 5.1 was obtained when d4–DHA was used as a substrate at −90 °C (Figure 3 inset). The reaction of 3–Sc with cyclohexane was found to be too slow relative to its self–decay at −90 °C; thus no kinetics could be monitored. However, when a solution of 3–Sc was allowed to warm up to 25 °C in the presence of 20 equivalents of cyclohexane, a 35 % yield of the aminated products was obtained. Additionally, 3–Sc could also initiate aziridination of cyclohexene and nitrene transfer to triphenyl phosphine (Figure S10) at −90 °C with the respective formation of cyclohexene–N–tosylaziridine (60 % yield) and N–(p–Toluenesulfonyl)iminotriphenylphosphorane (85 % yield).
Figure 3.
Plot of log k' for 3–Sc at −90 °C against BDE of different C–H substrates. k’ is determined by dividing the second–order rate constant k2 by number of equivalent H–atoms in the substrate. Inset: Plot of pseudo–first order rate constants (kobs) against different concentrations of DHA and d4–DHA. The point at zero substrate concentration corresponds to the pseudo–first order rate of the self–decay of 3–Sc at −90 °C.
The reactivity of 2 was also investigated and compared with that of 3–Sc. In contrast to the strong oxidizing capabilities of 3–Sc complex 2 was found to be a sluggish oxidant reacting only with strong reductants like triphenyl phosphine at 25 °C to form N–(p–Toluenesulfonyl)iminotriphenylphosphorane (75 % yield; Table S5); the rate of the reaction is orders of magnitude slower than that of 3–Sc (Figure S11). Additionally, 2 did not react at 25 °C even with the weak C–H bonds of DHA or CHD in presence or absence of scandium.
In summary, we have demonstrated the Lewis acid trapping of an elusive copper–tosylnitrene complex 3–Sc, which is shown to be diamagnetic and two–oxidation level above the Cu(I) complex 1–BF4. The stabilization of 3–Sc can be attributed to the binding of Sc3+ to the [CuNTs]+ core, which may help to reduce the strong electron repulsion between the electron rich nitrene and copper centers, presumably by lowering the electron density at the nitrene–nitrogen. In other words, the binding of Sc3+ may help to lower the H–atom abstraction ability of 3, thereby preventing its spontaneous decay to the copper(II)–amide species 2 (scheme 1). In consistent with the above explanation, use of weaker Lewis acids like Y3+ or Zn2+, instead of Sc3+, results in a significantly lower yield of the copper–nitrene intermediate and an increased formation of 2.12 Sufficient stability of 3–Sc at −90 °C enabled its characterization by a variety of spectroscopic methods, which helped to establish its electronic structure as CuII–N•(Sc)Ts with a copper–bound nitrene radical. Additionally, vibrational modes of the CuII–N•(Sc)Ts core have been established based on rR and DFT studies, which should help in their elucidation under catalytic turnover conditions. Finally, the present report of the stabilization of the CuII–N•Ts core may validate the existence of the isoelectronic elusive CuIII–O/CuII–O• units, which have been proposed as reactive intermediates in a number of chemical and biological oxidation reactions.21 In particular, the ability of 3–Sc to attack the strong C–H bonds of cyclohexane is extraordinary in the context of known oxidizing capabilities of copper–dioxygen species.22 With the assumption that the reactivity of the CuII–N•Ts core can be extended to the CuIII–O/CuII–O• core, the present study, therefore, suggests the possible involvement of CuIII–O/CuII–O• active species in the catalytic cycle of mononuclear copper–monooxygenases.
Supplementary Material
ACKNOWLEDGMENT
We gratefully acknowledge financial support of this work from the Cluster of Excellence “Unifying Concepts in Catalysis” (EXC 314/1), Berlin. XAS data were obtained on beamline X3B of the National Synchrotron Light Source (Brookhaven National Laboratory, Upton, NY, USA). Beamline X3B is operated by the Case Western Reserve University Center for Synchrotron Biosciences, supported by NIH Grant P30–EB–009998. NSLS is supported by the United States Department of Energy, Office of Science, Office of Basic Energy Sciences, under Contract DE–AC02–98CH10886. We also thank Dr. E. Bill, Prof. F. Neese, Prof. R. Stößer for access to the EPR instruments and Prof. C. Limberg for access to the GC-MS instrument.
Footnotes
ASSOCIATED CONTENT
Supporting Information
Additional syntheses and characterization data (UV/vis; EPR; NMR), kinetic data, experimental X–ray diffraction parameters and crystal data, computational data, figure and video showing the vibrational modes arising from Cu–NTs core. This material is available free of charge via the Internet at http://pubs.acs.org.
Authors declare no competing financial interest.
REFERENCES
- 1.Kwart H, Kahn AA. J. Am. Chem. Soc. 1967;89:1950. [Google Scholar]
- 2.Müller P, Fruit C. Chem. Rev. 2003;103:2905. doi: 10.1021/cr020043t. [DOI] [PubMed] [Google Scholar]
- 3.(a) Diaz–Requejo MM, Belderrain TR, Nicasio MC, Trofimenko S, Perez PJ. J. Am. Chem. Soc. 2003;125:12078. doi: 10.1021/ja037072l. [DOI] [PubMed] [Google Scholar]; (b) Fructos MR, Trofimenko S, Diaz–Requejo MM, Perez PJ. J. Am. Chem. Soc. 2006;128:11784. doi: 10.1021/ja0627850. [DOI] [PubMed] [Google Scholar]
- 4.(a) Badiei YM, Dinescu A, Dai X, Palomino RM, Heinemann FW, Cundari TR, Warren TH. Angew. Chem. Int. Ed. 2008;47:9961. doi: 10.1002/anie.200804304. [DOI] [PubMed] [Google Scholar]; (b) Li Z, Quan RW, Jacobsen EN. J. Am. Chem. Soc. 1995;117:5889. [Google Scholar]; (c) Diaz–Requejo MM, Perez PJ, Brookhart M, Templeton JL. Organometallics. 1997;16:4399. [Google Scholar]
- 5.a) King ER, Hennesy ET, Betley TA. J. Am. Chem. Soc. 2011;133:4917. doi: 10.1021/ja110066j. [DOI] [PubMed] [Google Scholar]; b) Lyaskovskyy V, Suarez AIO, Lu H, Jiang H, Zhang XP, de Bruin B. J. Am. Chem. Soc. 2011;133:12264. doi: 10.1021/ja204800a. [DOI] [PubMed] [Google Scholar]; c) Waterman R, Hillhouse GL. J. Am. Chem. Soc. 2008;130:12628. doi: 10.1021/ja805530z. [DOI] [PubMed] [Google Scholar]
- 6.(a) Brandt P, Södergren MJ, Andersson PG, Norrby P–O. J. Am. Chem. Soc. 2000;122:8013. [Google Scholar]; (b) Gillespie KM, Crust EJ, Deeth RJ, Scott P. Chem. Commun. 2001:785. doi: 10.1039/b104964j. [DOI] [PubMed] [Google Scholar]; (c) Tekarli SM, Williams TG, Cundari TR. J. Chem. Theory Comput. 2009;5:2959. doi: 10.1021/ct900277m. [DOI] [PubMed] [Google Scholar]; (d) Cundari TR, Dinescu A, Kazi AB. Inorg. Chem. 2008;47:10067. doi: 10.1021/ic801337f. [DOI] [PubMed] [Google Scholar]
- 7.Liang H–C, Zhang CX, Henson MJ, Sommer RD, Hatwell KR, Kaderli S, Zuberbühler AD, Rheingold AL, Solomon EI, Karlin KD. J. Am. Chem. Soc. 2002;124:4170. doi: 10.1021/ja0125265. [DOI] [PubMed] [Google Scholar]
- 8.Macikenas D, Skrzypczak–Jankun E, Protasiewicz JD. J. Am. Chem. Soc. 1999;121:7164. doi: 10.1002/1521-3773(20000602)39:11<2007::aid-anie2007>3.0.co;2-z. [DOI] [PubMed] [Google Scholar]
- 9.(a) Gonzalez–Alvarez M, Alzuet G, Borras J, Castillo Ld, Garcia–Granda S, Montejo JM. J. Inorg. Biochem. 2004;98:189. doi: 10.1016/j.jinorgbio.2003.10.012. [DOI] [PubMed] [Google Scholar]; (b) Macias B, Villa MV, Gomez B, Borras J, Alzuet G, Gonzalez–Alvarez M, Castineiras A. J. Inorg. Biochem. 2007;101:444. doi: 10.1016/j.jinorgbio.2006.11.007. [DOI] [PubMed] [Google Scholar]
- 10.Que L., Jr . Physical methods in bioinorganic chemistry: Spectroscopy and magnetism. University Science Books; 2000. [Google Scholar]
- 11.Pfaff FF, Kundu S, Risch M, Pandian S, Heims F, Pryjomska–Ray I, Haack P, Metzinger R, Bill E, Dau H, Comba P, Ray K. Angew. Chem. Int. Ed. 2011;50:1711. doi: 10.1002/anie.201005869. [DOI] [PubMed] [Google Scholar]
- 12.Other metal ions can also be used to generate the formal Cu(III) purple intermediate; however, the yield (Figure SX; Table) decreases in the order Sc3+(9%) > Y3+(60%) > Zn2+(20%) > Ca2+(0%), which follows the order of the decreasing Lewis–acidity of the metal ions ( Fukuzumi S, Ohkubo K. J. Am. Chem. Soc. 2002;124:10270. doi: 10.1021/ja026613o. )
- 13.Donoghue PJ, Tehranchi J, Cramer CJ, Sarangi R, Solomon EI, Tolman WB. J. Am. Chem. Soc. 2011;133:17602. doi: 10.1021/ja207882h. [DOI] [PMC free article] [PubMed] [Google Scholar]
- 14.King AE, Huffman LM, Casitas A, Costas M, Ribas X, Stahl SS. J. Am. Chem. Soc. 2010;132:12068. doi: 10.1021/ja1045378. [DOI] [PubMed] [Google Scholar]
- 15.Formation of Cu(I) was inferred from EPR (silent) and UV—Vis (no Cu(II) d–d bands) studies.
- 16.Fukuzumi S, Morimoto Y, Kotani H, Naumov P, Lee Y-M, Nam W. Nat. Chem. 2010;2:756. doi: 10.1038/nchem.731. [DOI] [PubMed] [Google Scholar]
- 17.Kau LS, Spira–Solomon DJ, Penner–Hahn JE, Hodgson KO, Solomon EI. J. Am. Chem. Soc. 1987;109:6433. [Google Scholar]
- 18.DuBois JL, Mukherjee P, Stack TDP, Hedman B, Solomon EI, Hodgson KO. J. Am. Chem. Soc. 2000;122:5775. [Google Scholar]
- 19.Lu CC, George SD, Weyhermüller T, Bill E, Bothe E, Wieghardt K. Angew. Chem. Int. Ed. 2008;47:6384. doi: 10.1002/anie.200800669. [DOI] [PubMed] [Google Scholar]
- 20.Luo Y–R. Comprehensive handbook of chemical bond energies. Taylor & Francis: 2007. [Google Scholar]
- 21.(a) Yoshizawa K, Kihara N, Kamachi T, Shiota Y. Inorg. Chem. 2006;45:3034. doi: 10.1021/ic0521168. [DOI] [PubMed] [Google Scholar]; (b) Crespo A, Marti MA, Roitberg AE, Amzel LM, Estrin DA. J. Am. Chem. Soc. 2006;128:12817. doi: 10.1021/ja062876x. [DOI] [PubMed] [Google Scholar]; (c) Hong S, Huber SM, Gagliardi L, Cramer CC, Tolman WB. J. Am. Chem. Soc. 2007;129:14190. doi: 10.1021/ja0760426. [DOI] [PMC free article] [PubMed] [Google Scholar]
- 22.(a) Lewis EA, Tolman WB. Chem. Rev. 2004;104:1047. doi: 10.1021/cr020633r. [DOI] [PubMed] [Google Scholar]; (b) Himes RA, Karlin KD. Curr. Opin. Chem. Biol. 2009;13:119. doi: 10.1016/j.cbpa.2009.02.025. [DOI] [PMC free article] [PubMed] [Google Scholar]
Associated Data
This section collects any data citations, data availability statements, or supplementary materials included in this article.


