Figure 1.

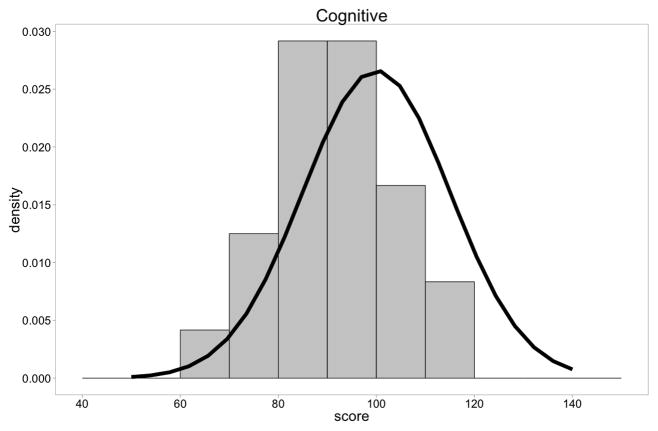
Figure 1A. Distribution of Bayley-III Cognitive Composite scores of DMD boys compared to normal children. There was a shift of the distribution to the left (t = −4.36, p=.0001).
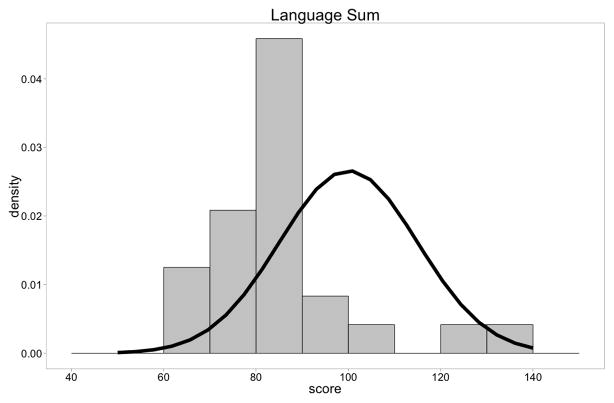
Figure 1B. Distribution of Bayley-III Language Composite scores of DMD boys compared to normal children(n=24). There was a shift of the distribution to the left (t=−4.42, p<.0001).
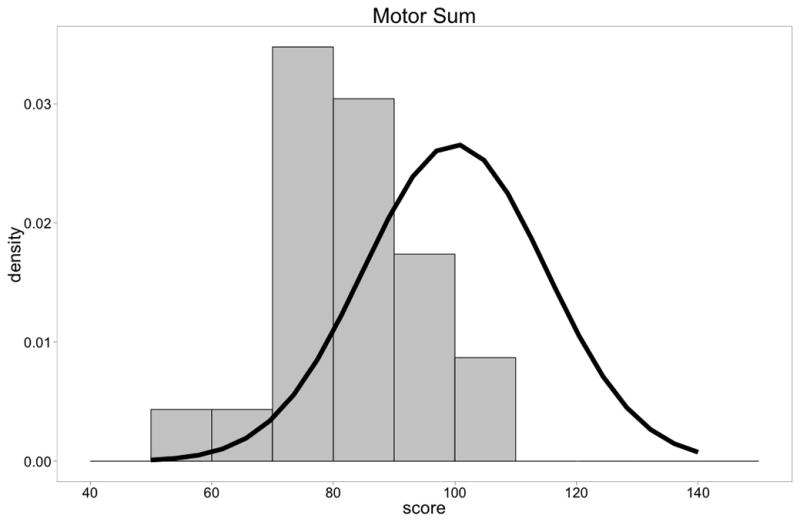
Figure 1C. Distribution of Bayley-III Motor Composite scores of DMD boys compared to normal children(n=23). There was a shift of the distribution to the left (t =−7.60, p=<.0001).


