Figure 2.
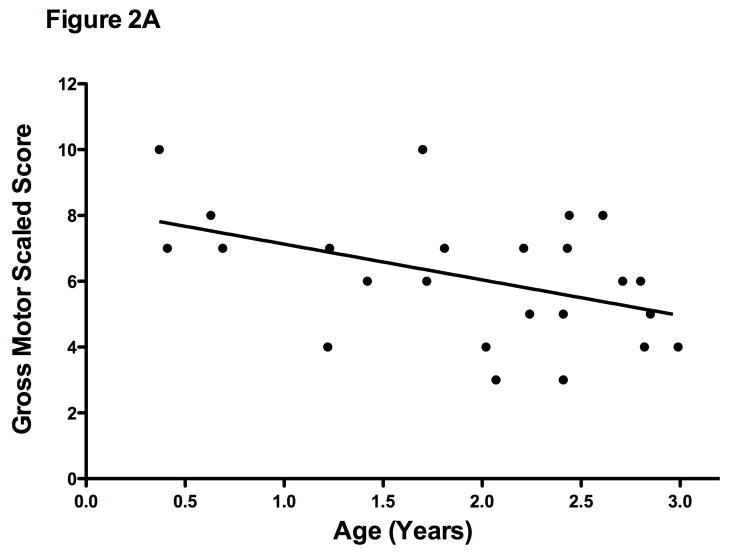
Figure 2A. Bayley-III Gross Motor Scaled Scores versus Age (n=24). There was a negative correlation with age (r = −0.45; p=.03) demonstrating motor function relative to typically developing children is low.
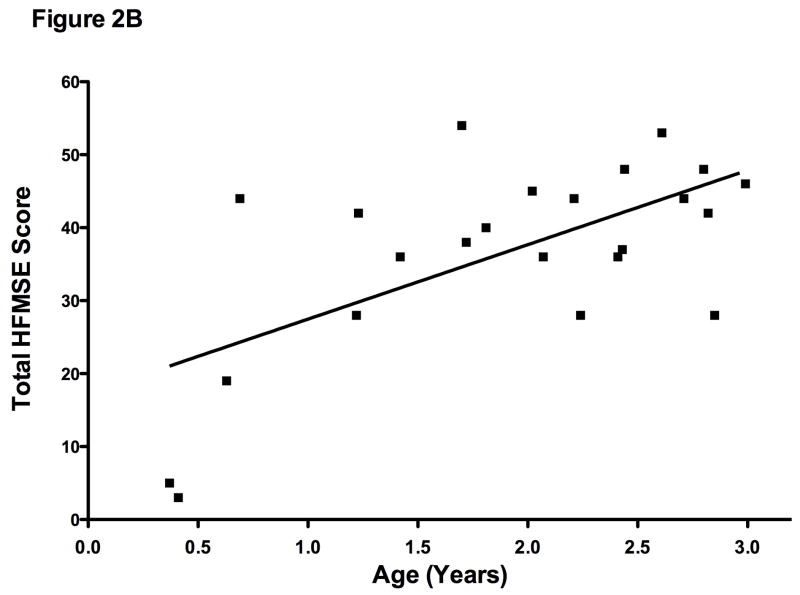
Figure 2B. Hammersmith Functional Motor Extended versus Age (n=23). There was a positive correlation with age (r = 0.63 p=.001) showing absolute motor gains are demonstrated across time.
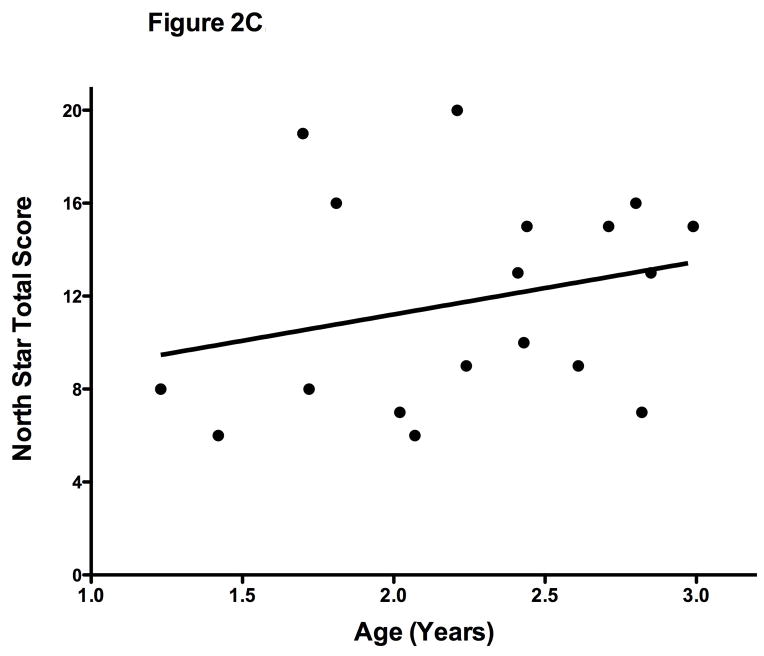
Figure 2C. North Star Ambulatory Assessment (n=18). There was not a significant correlation with age (r = 0.26; p=.3).


