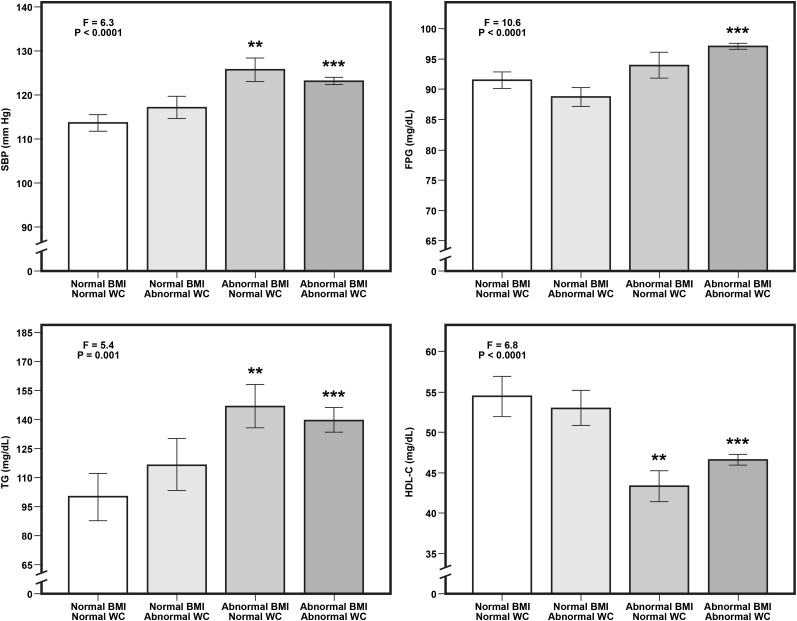
FIGURE 1.
Mean (±SEM) values for cardiometabolic risk factors in individuals with normal BMI and normal WC (n = 44), normal BMI and abnormal WC (n = 26), abnormal BMI and normal WC (n = 22), and abnormal WC and abnormal BMI (n = 400). In each panel, the F statistic and the accompanying P value indicate the overall difference in means between the 4 groups (1-factor ANOVA). Significant differences in means between the groups: ***P < 0.0001 and **P < 0.01 for comparison with the normal BMI and normal WC group (least-significant difference pairwise comparison test). Normal BMI (in kg/m2), <25.0; abnormal BMI, 25.0–34.9; normal WC, <80 cm (women) and <94 cm (men); and abnormal WC, ≥80 cm (women) and ≥94 cm (men). C, cholesterol; FPG, fasting plasma glucose; SBP, systolic blood pressure; TG, triglycerides; WC, waist circumference.

