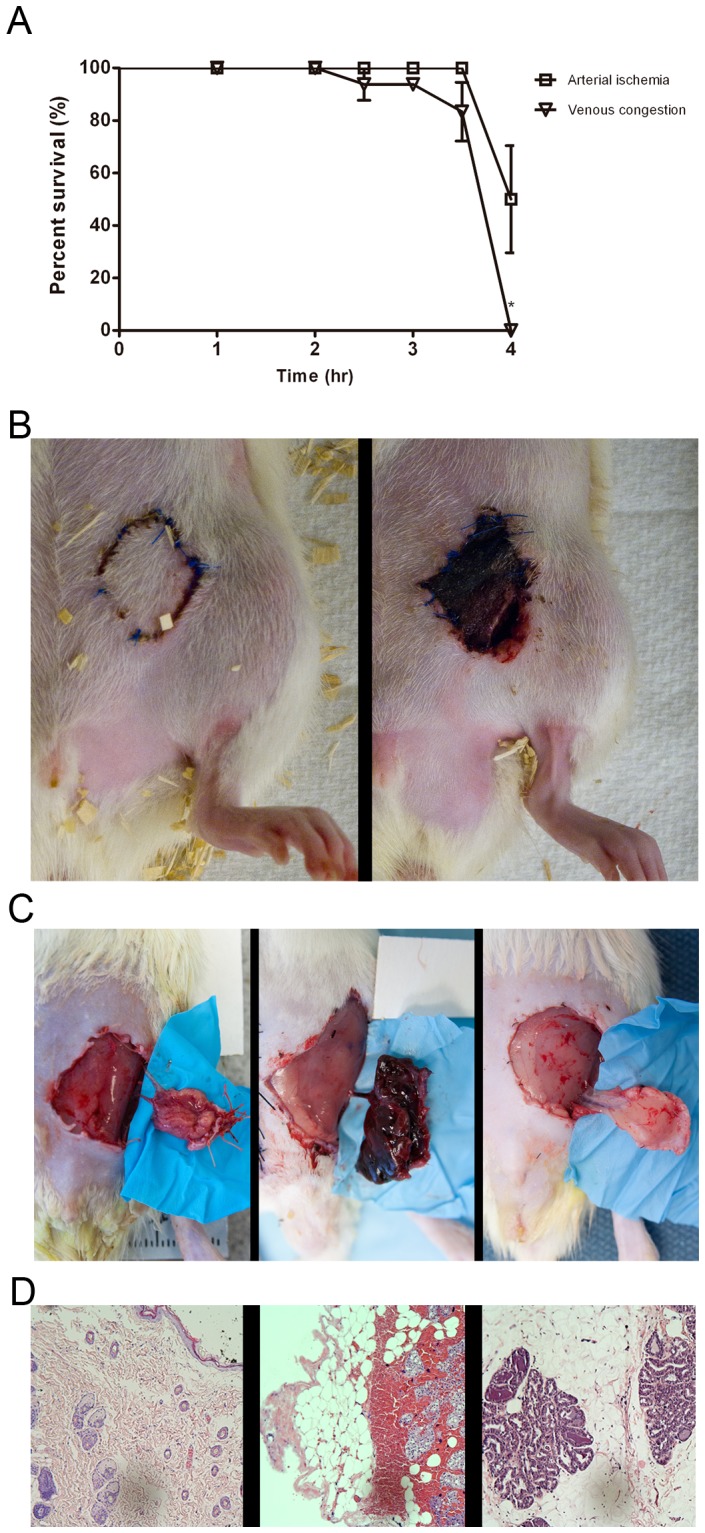
Figure 2. Phenotype analysis, temporal profile of flap survival following vessel occlusion.

A) Bar graph of percent flap survival of ischemia-reperfusion vs. time on postoperative day 6 of arterial ischemia and venous congestion. Data are expressed as means ± SE and analyzed by unpaired t-test. *P<0.05. B) Gross photos of flaps at 3.5 vs. 4 hours of venous congestion C) From left to right, gross photos of flaps subjected to 4 hours of arterial ischemia and venous congestion compared to control D) Histology showing flaps subjected to 4 hours of venous congestion showing extravasation of blood, while control specimen and arterial ischemia lack such findings.
