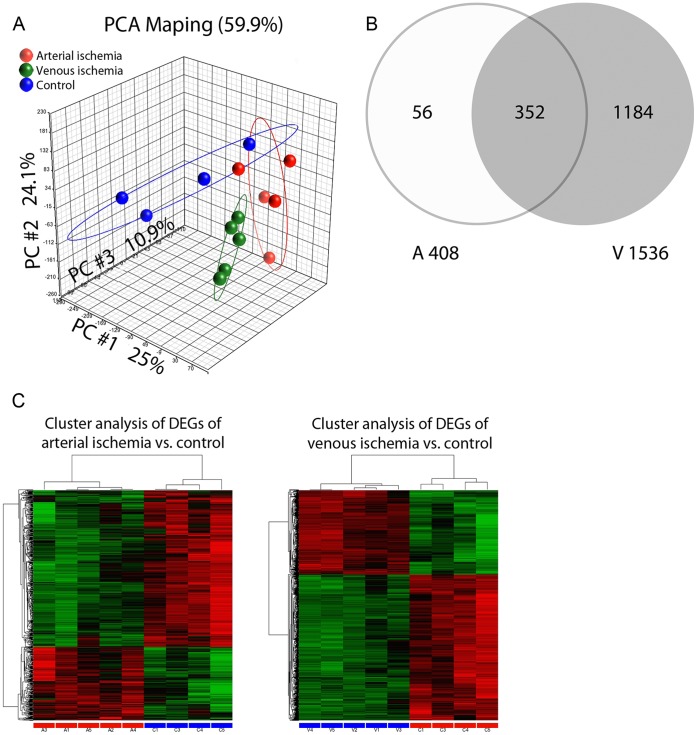
Figure 3. Global transcriptome profiles in ischemic flaps.
A) PCA diagram B) Venn diagram of differentially expressed genes upon 4 hours of arterial ischemia and venous congestion C) Hierarchical cluster analysis of the differentially expressed genes in rats following 4 hours of arterial ischemia and venous congestion.

