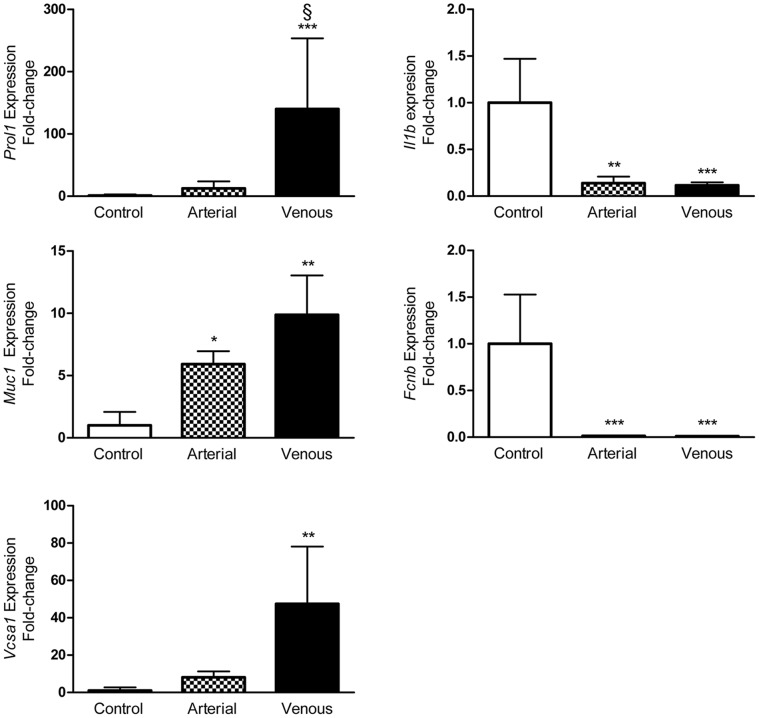
Figure 5. Temporal expression profile of selected genes under venous congestion.
qRT-PCR performed on Prol1, Muc1, Vcsa1, Fcnb, Il1b for flaps undergoing venous congestion compared to control at t = 1, 3, 4 hrs. Data are expressed as means ± SE and analyzed by unpaired t-test. *P<0.05, **P<0.01, ***P<0.001.

