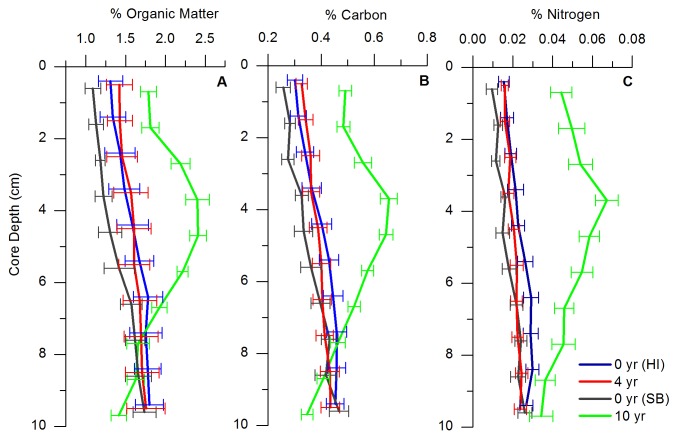
Figure 1. Vertical average down-core profiles of sediment characteristics in the top 10 cm.
A) Percent organic matter (% OM); B) Percent organic carbon (% C); C) Percent nitrogen (% N) for 4 age treatments (0- (HI), 4-, 0- (SB), and 10-year) in top 10 cm of sediment, where error bars indicate standard error. Averages for each variable were calculated in 1-cm intervals to a depth of 10 cm.

