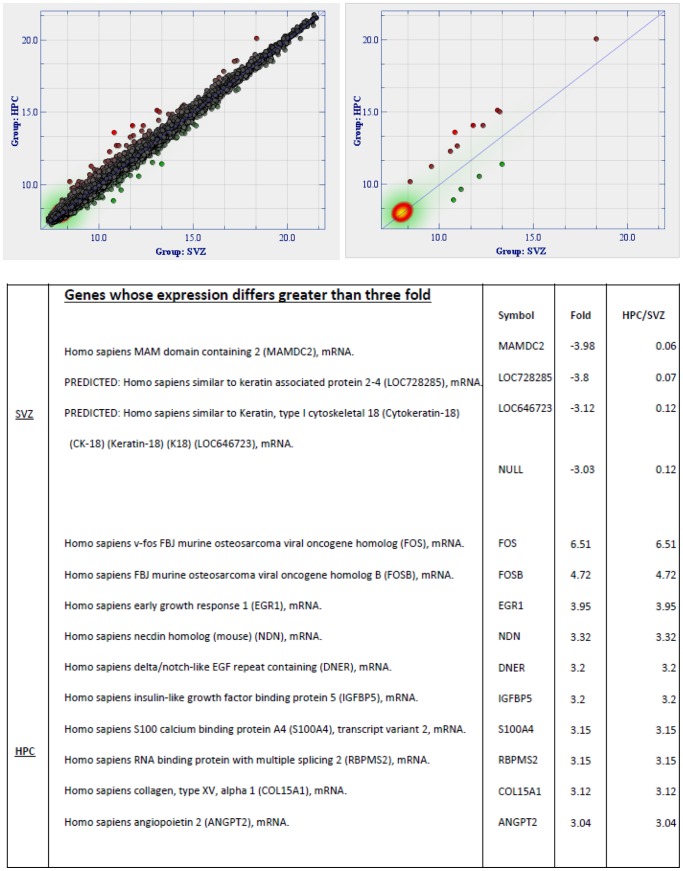
Figure 7. SVZ compared to HPC.
Graphic output from the ‘Fold Change’ tool of J-Express software for microarray analysis comparing a group of three hippocampus-derived stem cell lines with those derived from the same three patients’ subventricular zone-derived stem cells. Left side: Differences in 37880 individual gene expression levels (distance from the diagonal) are indicated by the colored dots. Genes differing by three or greater fold (14 only) between the two groups are indicated on the right side. Table List of genes differing more than 3-fold between three SVZ-derived and three HPC-derived stem cell lines.

