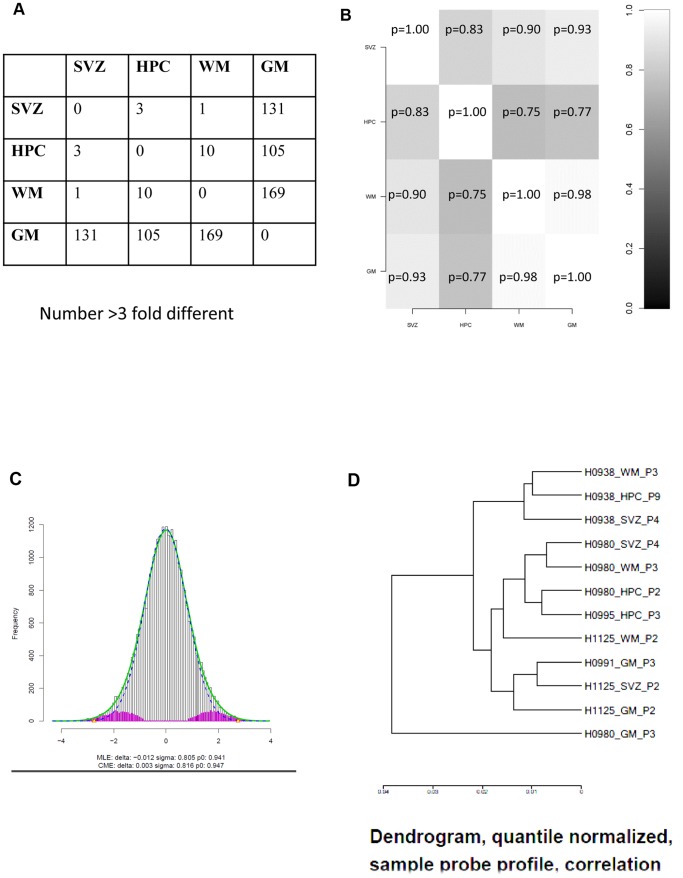
Figure 8. Are stem cell sources different based on microarray analysis.
Relatedness of cultures from 3 humans/4 sources/1 platform. A. Two way table showing number of genes (mean; n = 3) differing by more than three fold. Total number of genes in this comparison: 34694. B. ‘Globaltest’ analysis revealing probability for the null hypothesis after testing differences between cell culture groups (n = 3). C. Histogram: the white bars show a test statistic for a paired t-test of HPC vs SVZ (individual cultures from each human have been paired). The blue line shows what one would expect if there were no real differences (just random, due to technical noise etc). The pink bars are what the method estimates as real differences calculated as the difference between the white bars and the blue line). The method estimates that around 6% of the genes are different between SVZ and HPC. D. The similarity between the expression profiles is determined by hierarchical cluster analysis and shown as a dendrogram. The length of the line connecting two samples indicates the similarity between the samples (short line: highly similar pattern). Dendrogram generated by Norwegian Microarray Consortium from quantile normalized data.

