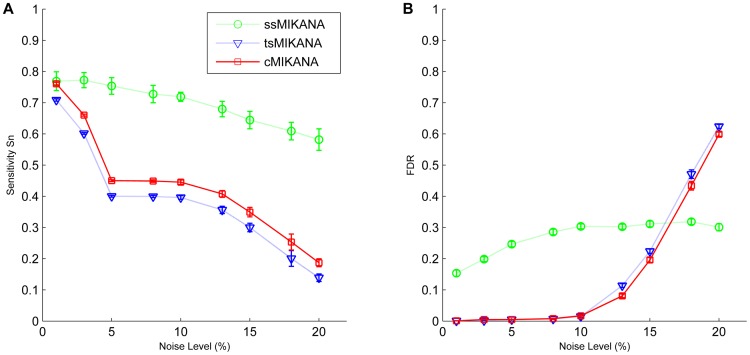
Figure 1. Influence of noise level on the performance of ssMIKANA, tsMIKANA and cMIKANA network inference methods.
Different MIKANA network models were inferred from 100-gene scale-free networks. The sensitivity and false discovery rate (FDR) from MIKANA inference methods with steady-state data only (ssMIKANA), time-series data only (tsMIKANA) and the combination of steady-state and time-series data (cMIKANA) are compared. Different noise levels, 1%, 3%, 5%, 8%, 10%, 13%, 15%, 18% and 20%, were added to data, respectively.

