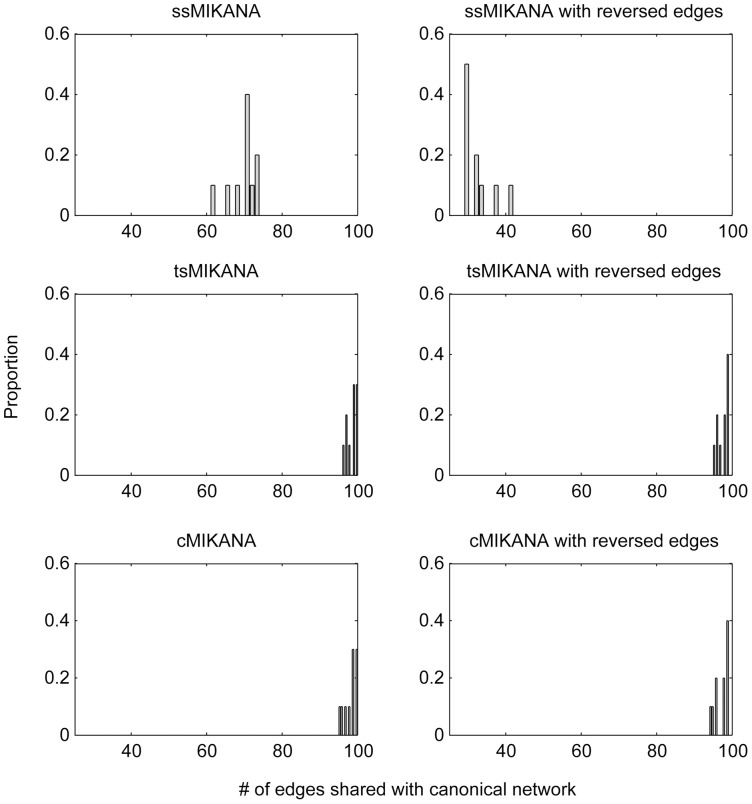
Figure 3. Comparison of the directionality of edges in the ssMIKANA, tsMIKANA and cMIKANA network models.
Scale-free networks with 100 genes were generated and related steady-state datasets were simulated. Time-series data were collected at each time point in 10 replicates. 10% noise were added to data. The proportion of edges in the canonical networks found in the forward network models (left column) and in the reversed network models (right column) were computed.

