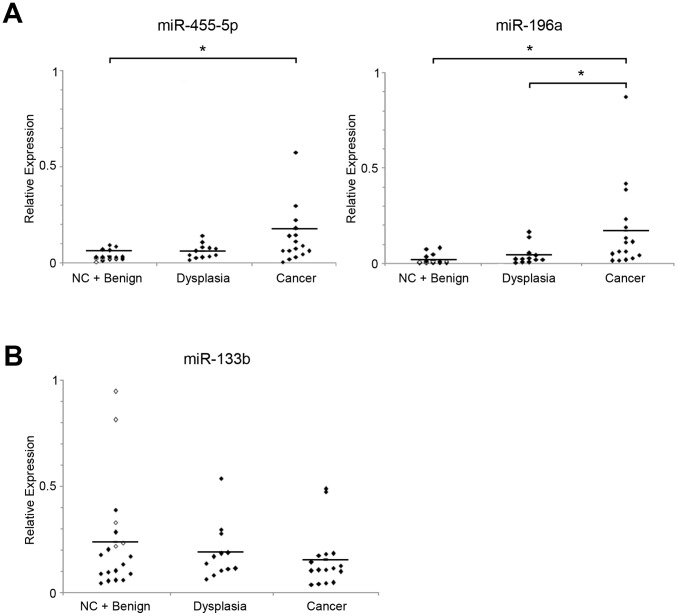
Figure 3. Significant up-regulation of miR-455-5p and miR-196a in multiple laryngeal cancer samples.
(A) Expression levels of miR-455-5p and miR-196a were measured by TaqMan® qRT-PCR using 48 tissue samples. Adjacent noncancerous tissues (noncancerous counterparts, NCs) are shown as open quadrangles. Significant up-regulation of miR-455-5p was observed in cancers compared with NCs and benign samples. Expression levels of miR-196a were significantly higher in cancer tissues when compared with either NCs and benign samples or precancerous dysplasia samples. Bars indicate mean value of each group. *, p<0.05. (B) Expression levels of miR-133b were also examined in multiple samples. Although relatively lower expression was observed in cancers, the differences were not statistically significant when compared with other groups. Bars indicate mean value of each group. *, p<0.05.

