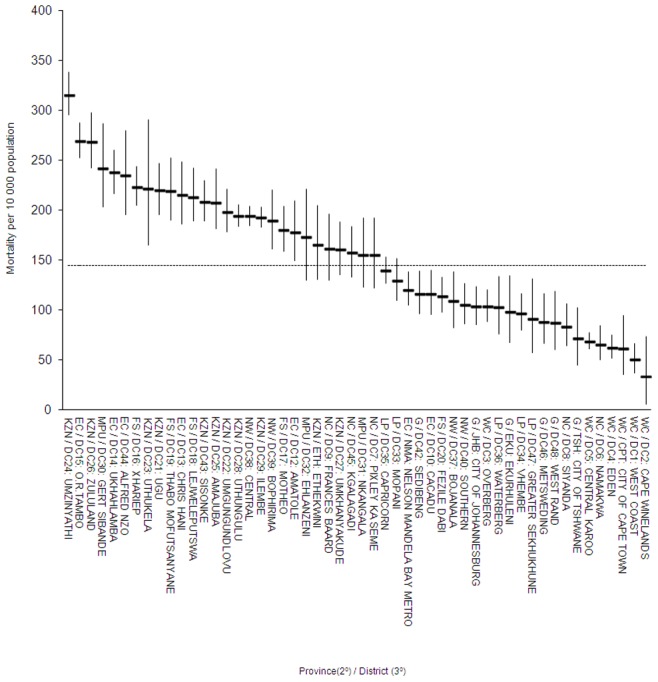
Figure 3. Descending district level adult mortality proportions with 95% confidence intervals and highlighting significantly high or low tertiary (districts) areas, South Africa, 2007 (KZN Kwazulu-Natal: EC: Eastern Cape; MPU: Mpumalanga; FS: Free State; NW: North West; NC: Northern Cape; LP: Limpopo; G: Gauteng; WC: Western Cape).

Dashed line represents the national average.
