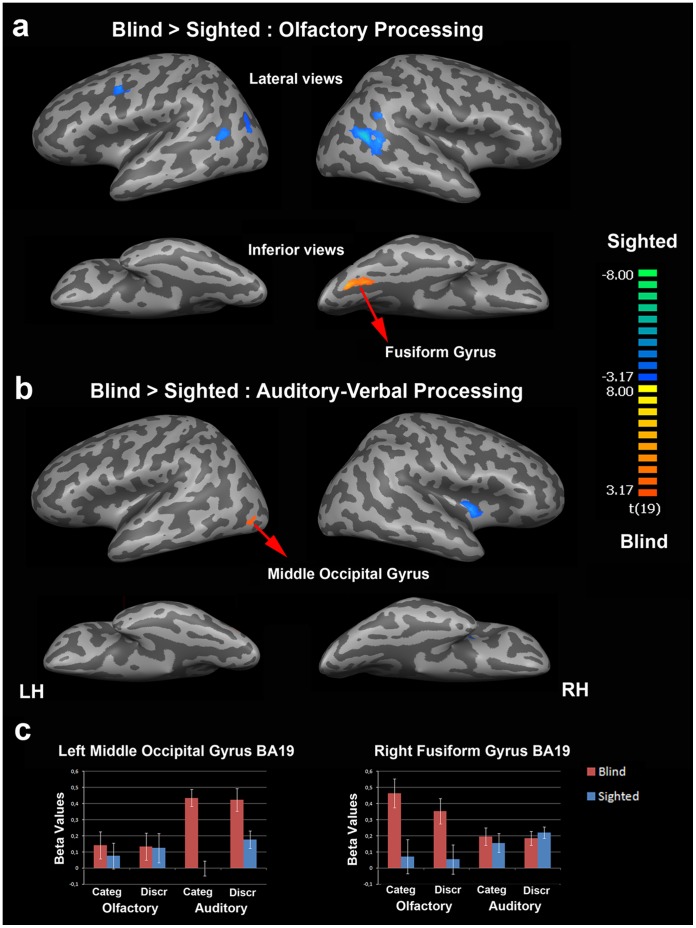
Figure 2. Between-group comparisons for olfactory and auditory-verbal processing.
(a) Brain regions that were more activated in EB than in SC subjects during olfactory processing are in orange-yellow and those with higher activation in SC than in EB subjects are in blue-green according to the color scale that codes the t-values. (b) Comparison of brain activation patterns in EB and SC subjects during auditory-verbal processing (same color code as in (a)). For display purposes, results were shown using a p<005, uncorrected threshold, with a cluster size threshold of corrected p<0.05. The two main activation foci that were more activated in EB than SC subjects as revealed by the group comparison were the right fusiform gyrus (x = 24, y = −67, z = −13) and the left middle occipital gyrus (x = −46, y = −73, z = −5). Both activation foci were located in the ventral part of the occipital cortex. The activation focus in the left middle occipital gyrus was located in the posterior part of the ventral lateral occipital complex [54]. (c) Brain activity profiles (i.e. beta values as a function of task, modality and group) in the left middle occipital gyrus (left side) and in the right fusiform gyrus (right side) as identified in the group comparisons (see (a) and (b)). In each of these two regions, there was a clear dissociation between the olfactory and auditory-verbal conditions (double dissociation) in EB subjects; the right fusiform gyrus showed a preference for olfactory processing and the left middle occipital gyrus was more activated during the auditory-verbal conditions. Error bars are standard errors of the means (s.e.m.). LH, left hemisphere; RH, right hemisphere.

