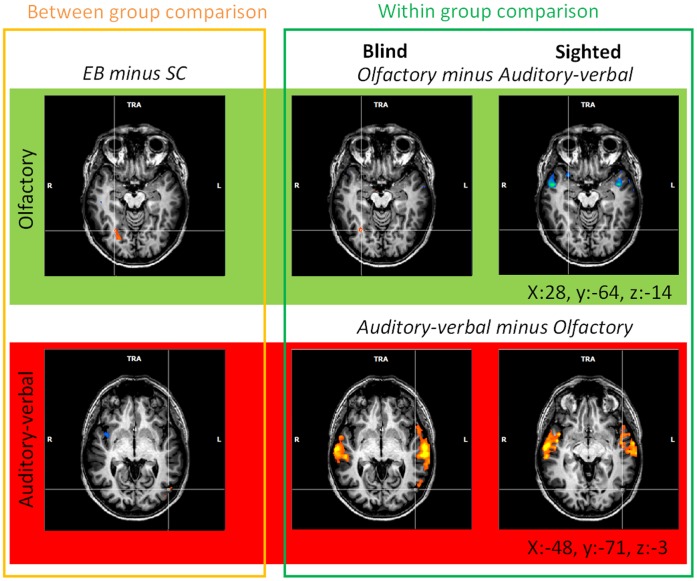
Figure 3. Dissociation between olfactory and auditory-verbal processing in the occipital cortex.
Activation maps resulting from a group comparison in each modality (left part of the Figure) and comparisons between the olfactory and auditory-verbal modalities in EB and SC subjects (within group comparison, middle and right parts of the Figure). The activation maps were obtained using random-effects analyses (RFX) with a threshold of p<0.001 (uncorrected). Brain activation foci were superimposed on transversal sections of the normalized MRI brain of a representative subject. The crosshairs always intersect on the same voxel in the right fusiform gyrus (FG, x:28, y:−64, z:−14; top of the Figure) and in the left middle occipital gyrus (MOG, x:−48, y:−71, z:−3; bottom of the Figure). Between-group comparisons revealed that the right FG was more activated in EB than in SC subjects during olfactory processing and that the left MOG was more activated in EB than in SC subjects during auditory-verbal processing (see also Figure 2 and Table S2). In EB subjects, within-group comparisons showed that part of the right FG was more activated during olfactory than auditory-verbal processing and that part of the left MOG was more activated during auditory-verbal than olfactory processing whereas such activation foci were not observed in sighted subjects (see Tables S3–4). R: right, L: left.

