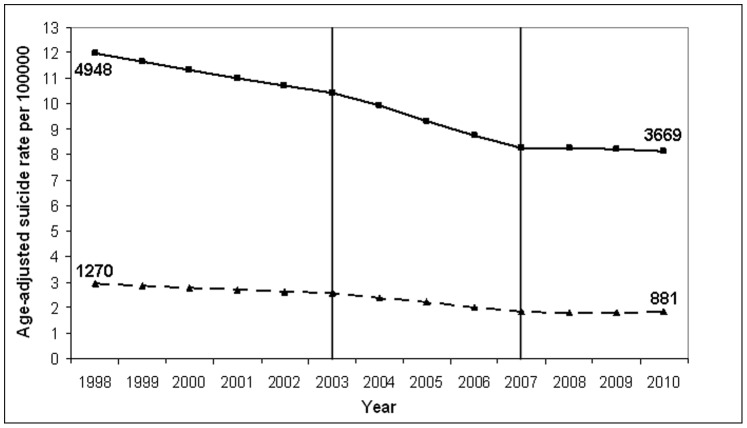
Figure 4. Age-adjusted suicide rates for hanging in Germany (1998–2010) for males and females, separately.
Suicide rate per 100000 inhabitants (reference year: 1998); suicide method: “Hanging, strangling or suffocation” (according to ICD-10: X70). –– Age-adjusted suicide rates for men (with squares); …….Age-adjusted suicide rates for women (with triangles). Vertical lines represent the joinpoints which had been identified for the overall suicide mortality trends in Germany 1998–2010. The numbers in the figure represent suicide frequencies in males and females, for the years 1998 and 2010, respectively. obs. = observed values; mod. = modelled values (according to the joinpoint regression analysis).

