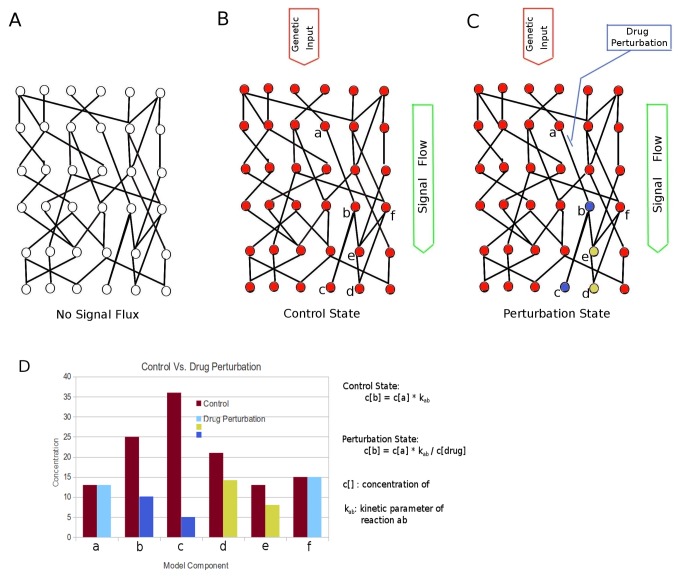
Figure 5. Visualization of the Flux-Comparative-Analysis.
A: empty flux state of model network; B: control state of model network; C: perturbation state (drug inhibition) of model network. D: the comparison of model components between control state and perturbation state. The mathematical implementation of both states in the model is described.

