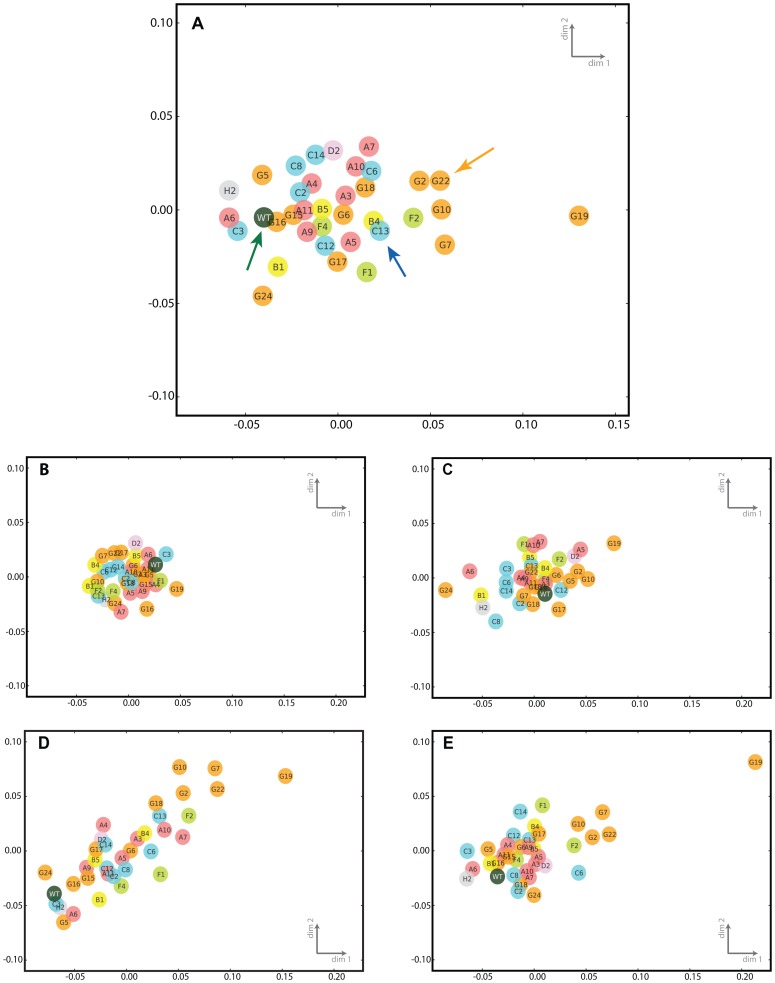
Figure 1. Transcriptional phenotypes of abc-transporter mutants.
We determined the transcriptional phenotypes of the wild-type AX4 strain (WT) and 35 abc-transporter mutant strains at 0-, 6-, 12- and 18-hours of development. The relations between the transcriptional phenotypes are illustrated using multidimensional scaling, where the strains appear close together if their phenotype distance is small, or appear apart from each other if the phenotype distance is large. We constructed multidimensional scaling plots by considering transcriptional profiles for all the time points together where transcriptional profiles of each mutant at 0-, 6-, 12- and 18-hours were concatenated prior to distance computation (A) and for individual time points, 0-hours (B), 6-hours (C), 12-hours (D), and 18-hours (E). The axes are dimensionless. Each circle represents a strain, with an abbreviated strain name inside (e.g. G19 stands for abcG19 −). The colors indicate classes of ABC transporters. Arrows point to specific strains that are similar: tan – mutants showing delayed development, blue – abcB4− and abcC13−, green – wild type.

