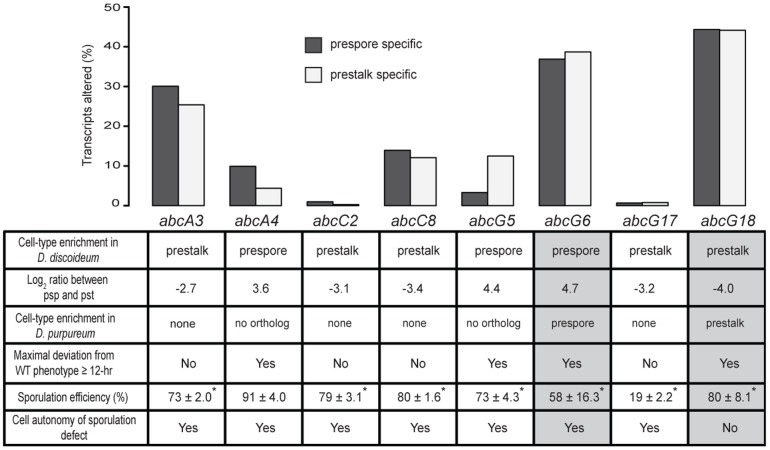
Figure 4. Cell type enriched abc-transporter transcripts and their effect on cell-type differentiation.
The bar graph shows the fraction (%) of prespore- or prestalk- enriched transcripts that were altered in each of the mutants compared to the wild type. The names of the mutated abc genes are indicated below the bars. The table below the graph summarizes properties of the abc-transcripts in wild-type cells (first three rows) and the phenotypes of the respective mutant strains (last three rows). Sporulation efficiency is shown as the fraction (%) of the cells that made spores +/− S.E.M.; * indicates statistically significant difference from AX4 (Student's t-test, two sided, n = 3, p-value<0.005).

