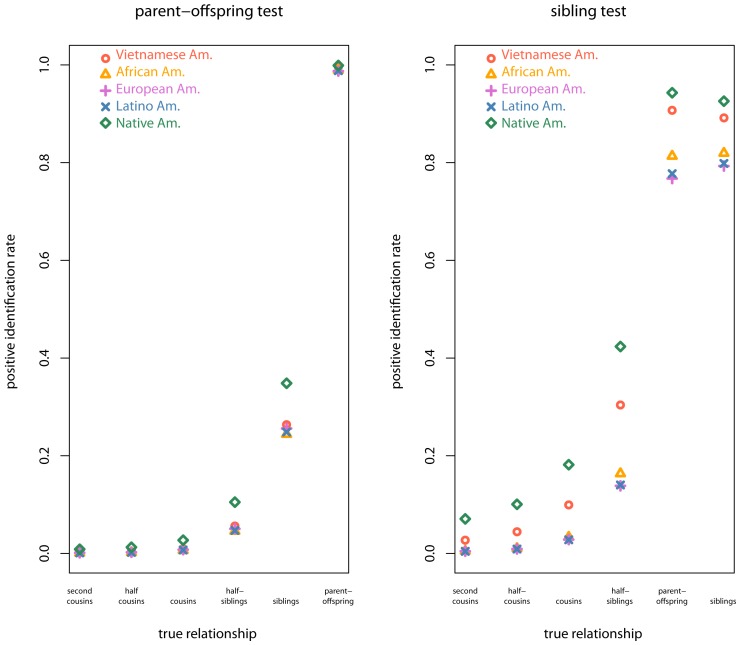
Figure 1. Distributions of the test statistic  , defined in (4), for sibling test for individuals who are siblings (solid red), parent-offsprings (solid black), half-sibs (dashed black), cousins (dashdot black), and second cousins (dotted black).
The population sample individuals are sampled from is along the top and the assumed pop sample is along the side.

