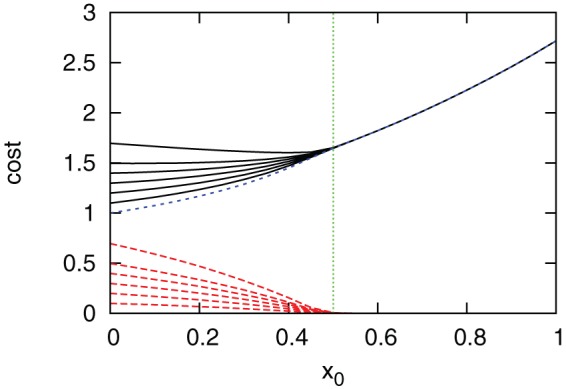
Figure 1. Cost versus  for
for  (from bottom to top) in homogeneous networks.

(The green dotted vertical line) the theoretical solution  ; (the blue short dashed line) the cost of vaccination; (the red dashed lines) the cost of treatment; and (the black solid lines) the total cost. Parameters are set as
  ,
,  , and
, and  . The basic per capita cost is set as
  and the vaccine efficacy is
  .
.
