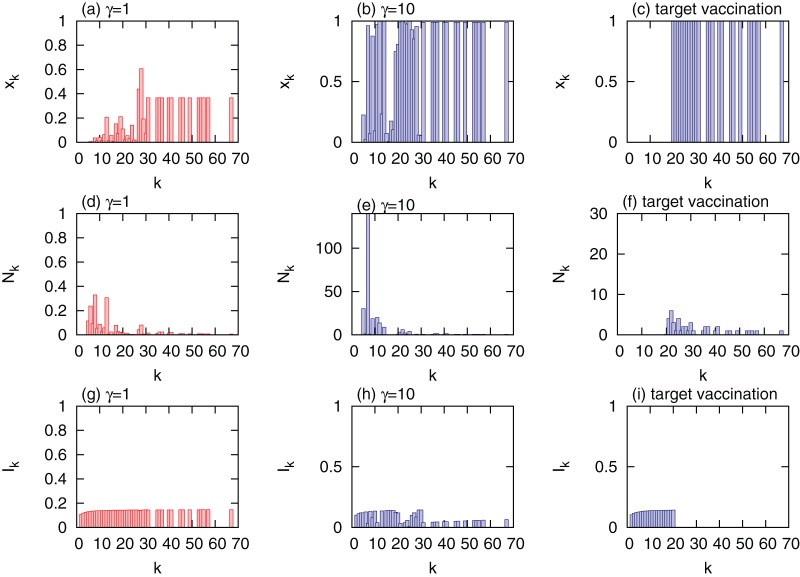
Figure 3. Comparison of optimal allocations of vaccines with target vaccination in uncorrelated scale-free networks.
Optimal allocation  (a),
(a),  (d), and
  (g) for
  (left column); optimal allocation
  (b),
(b),  (e), and
  (h) for
  (center column); target allocation
  (c),
(c),  (f), and
  (i) (right column). At equilibrium, the fractions of infected nodes are
  (
( ),
),  (
( ), and
  (target vaccination), respectively. The total costs for the optimal allocation are
  (
( ),
),  (
( ),
),  (
( for target vaccination), and
  (
( for target vaccination).
  and the maximal vaccination coverage is
  . The degree distribution is generated with
  and the network size
  . The minimal degree is
  and the maximal degree is
  . Nodes are grouped into 30 groups.

