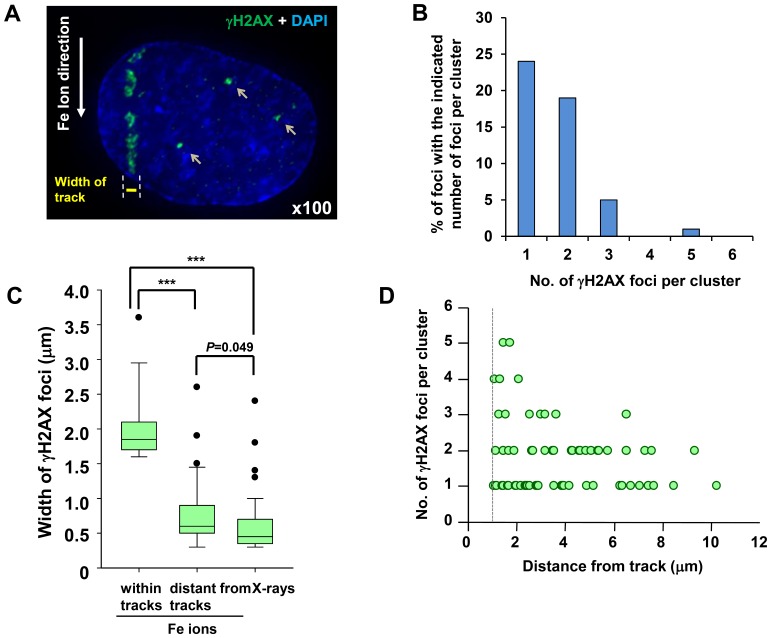
Figure 6. γH2AX foci at sites distinct to the tracks showing less clustered damage.
(A) Typical image of DSB formation outside of the particle track following Fe ion irradiation. 48BR (WT) primary G0/G1 cells were irradiated with 1 Gy Fe irradiation, fixed at 30 min, and stained with γH2AX and DAPI. (B) Percentage of individual foci within a cluster at non-track regions was analysed from >100 individual foci. 48BR (WT) cells were irradiated and fixed at 30 min post 1 Gy Fe irradiation. (C) The width of clustered γH2AX foci post Fe irradiation within the particles tracks, at non-track regions following Fe irradiation or following X-irradiation. >50 foci were analysed in each sample. The diameter of clustered γH2AX foci after Fe ions is ∼3–4 fold greater than the width of γH2AX foci arising after X-rays, whilst the foci diameter of non-track γH2AX foci is similar to that arising following X-rays. The width of foci is measured by IMARIS in 3D using images taken by the DeltaVision microscope. (D) Foci complexity is negatively correlated with distance from the particle track. γH2AX foci at non-track regions in 48BR cells were analysed following 1 Gy Fe irradiation. Cluster analysis was performed as described in Figure 3–4. To allow the analysis of γH2AX foci close to the particle track, we used a distance of 1 µm to distinguish non-track from track damage and carried out the analysis at 30 min exposure to minimise the movement of γH2AX foci within tracks. Images were taken by DeltaVision microscope followed by deconvolution and analysed (A–D). Cells forming a single γH2AX track of length >8 µm and width >1 µm were analysed in B and C.

