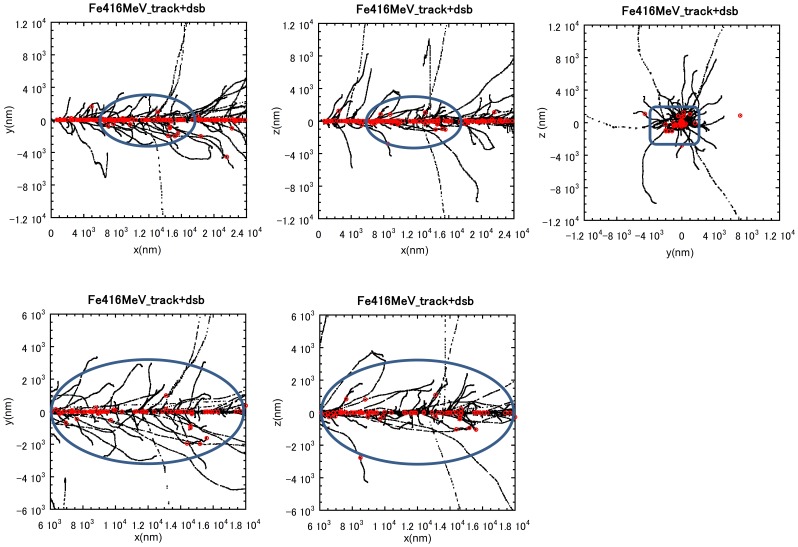
Figure 7. Track structure simulation and spatial distribution of DSBs arising from an Fe ion track.
A Simulation of the structure of damage arising from a single Fe ion particle traversal. The black marks and the red marks represent the tracks of Fe ions and the position of DSBs, respectively. The blue ellipsoid shape shows the size of the nucleus. The slighter wider band of the damage within the tracks observed in these experiments is likely explained by DNA movement after radiation exposure. The number of electrons generated decreases as the electron energy decreases. For 416 MeV/n Fe ions, ∼90% of electrons generated are estimated to have energies less than 100 eV. The range of such low-energy electrons is less than a few nm. The majority of other electrons have a range from a nm to 5 µm. The highest energy electrons with a range of a few hundred µm can also arise but at a low frequency (<0.1%).

