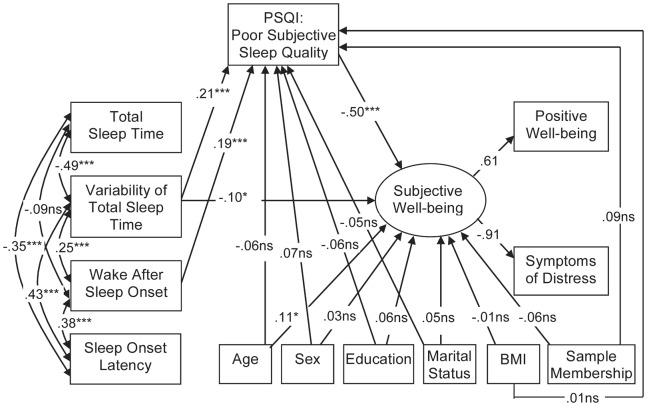
Figure 1. Relations of actigraphic sleep indices, subjective sleep quality, and subjective well-being.
Standardized estimates are presented. Chi2 = 32.9, df = 16, P = 0.008; CFI = 0.98; RMSEA = .049; GFI = 0.99; AGFI = 0.94. Note. Total Sleep Time, Variability of Total Sleep Time, Wake After Sleep Onset, and Sleep Onset Latency were assessed by actigraphy. Non-significant paths from actigraphy measures were trimmed, non-significant paths from covariates were not trimmed. Abbreviations: PSQI: Pittsburgh Sleep Quality Index; BMI: Body Mass Index. *P<.05, **P<.01, ***P<.001, ns P>.05.

