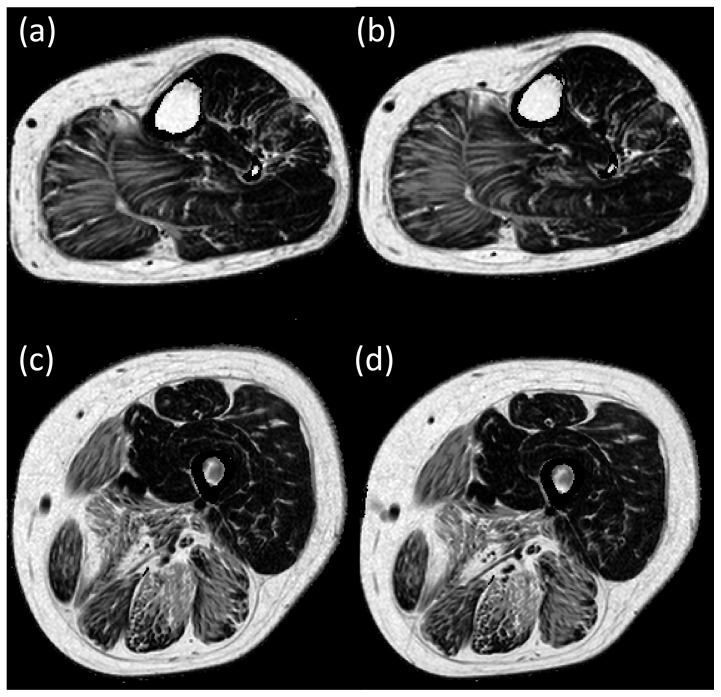
Figure 4. Quantitative fat fraction images at baseline in an individual patient (a – mid lower leg level, c – mid thigh level) and at 12 months follow-up (b – mid lower leg level, d – mid thigh level).
Analysis reveals an increase in fat fraction of the lateral and medial gastrocnemius, sartorius, gracilis, semitendinosus, rectus femoris and vastus lateralis.

