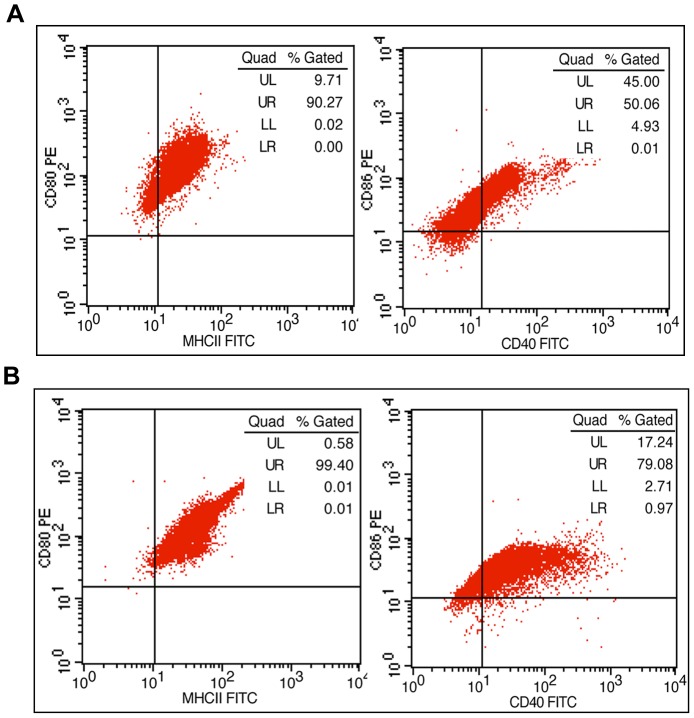
Figure 8. The expression of surface antigens.
(A) P0. (B) P3. The positive ratios of MHCII (99.40%) and CD40 (80.05%) for P3 cells were higher than the ratio for P0 (MHCII: 90.27%; CD40: 50.07%); the positive ratios for CD86 in P0 and P3 cells were over 95%; the CD80 positive ratios in P0 and P3 cells were both approximately 99%.

