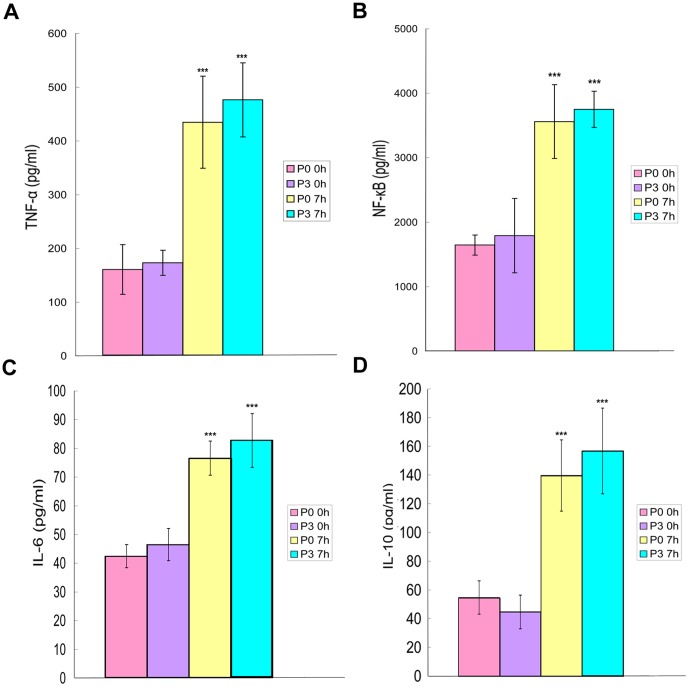
Figure 9. Cytokine production.
P0 and P3 cells were stimulated with LPS for 0 h and 7 h. The abundance of TNF-α (Fig. 9A), NF-κB (Fig. 9B), IL-6 (Fig. 9C) and IL-10 (Fig. 9D) increased over time and showed significant differences (p<0.001). However, there were no significant differences detected between P0 and P3 cells for inflammatory or anti-inflammatory cytokines at any of the time points measured. Error bars represent mean values ± standard deviation; *** p<0.001.

