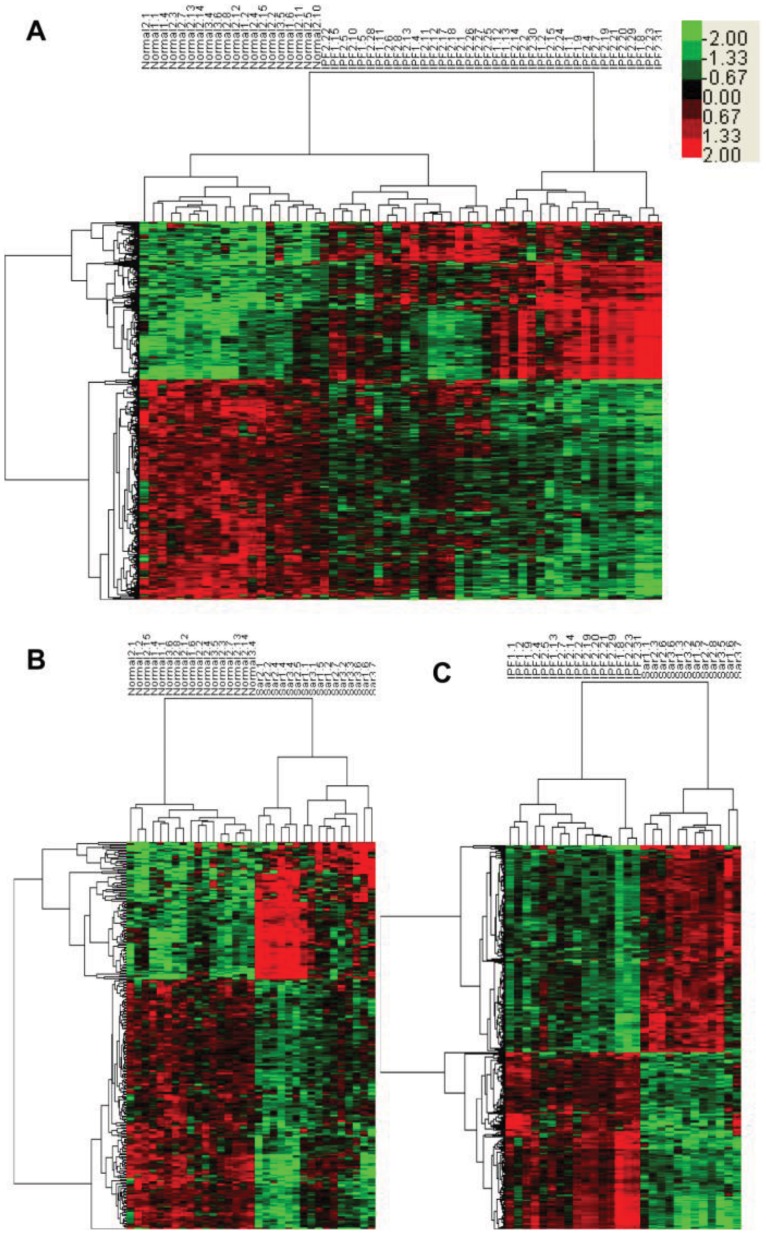
Figure 3. Significant expressed genes from normal vs. IPF, normal vs. sarcoidosis and IPF vs. sarcoidosis comparisons.
Supervised classification results for each comparison using SAM based on unsupervised TWC results. (A) Hierarchical clustering of samples of IPF (n = 38) and normal (n = 20) with 197 IPF up regulated and 275 IPF down regulated significant expressed genes. (B) Hierarchical clustering of samples of sarcoidosis (n = 16) and normal (n = 17) with 96 sarcoidosis up regulated and 174 sarcoidosis down regulated significant expressed genes. (C) Hierarchical clustering of samples of IPF (n = 16) and sarcoidosis (n = 12) with 382 IPF up regulated and 326 IPF down regulated significant expressed genes. Colorbar in the upper right corner shows the relative quantity of each gene.

