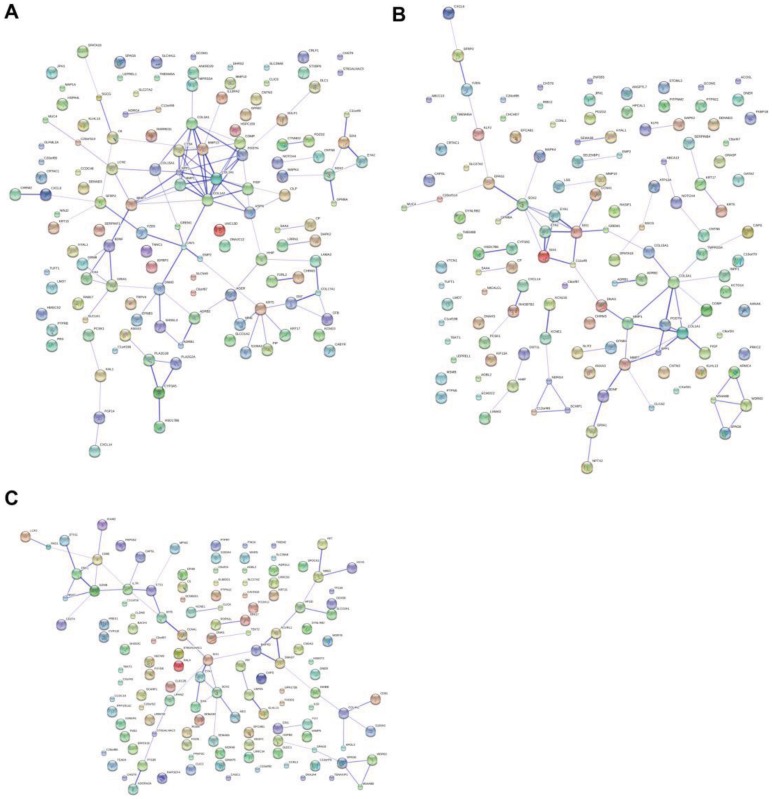
Figure 6. Interactions of major distinct expressed genes.
Panels A, B and C show gene to gene interactive net work of the top 130 signature genes in comparisons of normal vs. IPF, normal vs. sarcoidosis and IPF vs. sarcoidosis. The darker strength of lines indicates stronger interactions between different genes.

