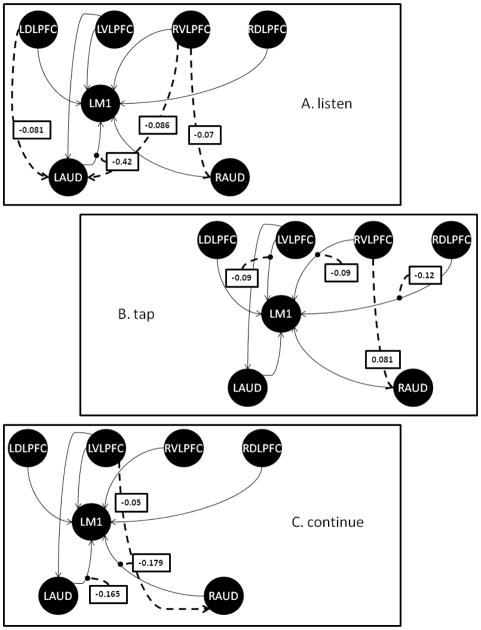
Figure 3.
Path diagrams for the three modulatory task conditions: A. Listen, B. Tap, C. Continue. Baseline connectivity that remained unmodulated by the respective task phase is indicated by the thin solid arrows, while task-dependent modulations are shown by thick, dashed arrows. The values given in the boxes represent the modulatory value and NOT the overall net path weight. While only modulatory values for significantly modulated paths are indicated, we note that the path weights summarized in Figure 1 for the baseline, intrinsic connectivity still apply for any unmodulated paths (thin solid arrows).

