
Fig. 2. Interaction entropy model of model of TLR-associated SNPs and prostate cancer risk for U.S. men of African descent.
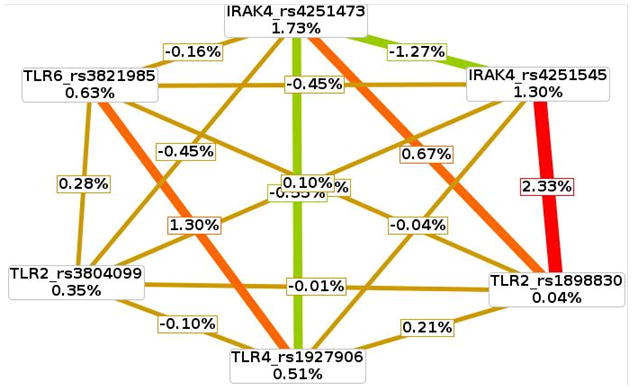
This graphical model describes the percent entropy as explained by each single TLR-related SNP or a combination of two loci within the U.S. population. Information gain or synergy is expressed as positive percent entropy. Redundant or missing information gain is expressed as negative percent entropy. A range from synergy (i.e. non-additive) to redundancy is represented using a schematic coloration in the visualization tool. The colors range from red representing a high degree of synergy (positive information gain), orange a lesser degree, and gold representing independence and a midway point between synergy and redundancy. Green represents redundancy.