
Figure 2.
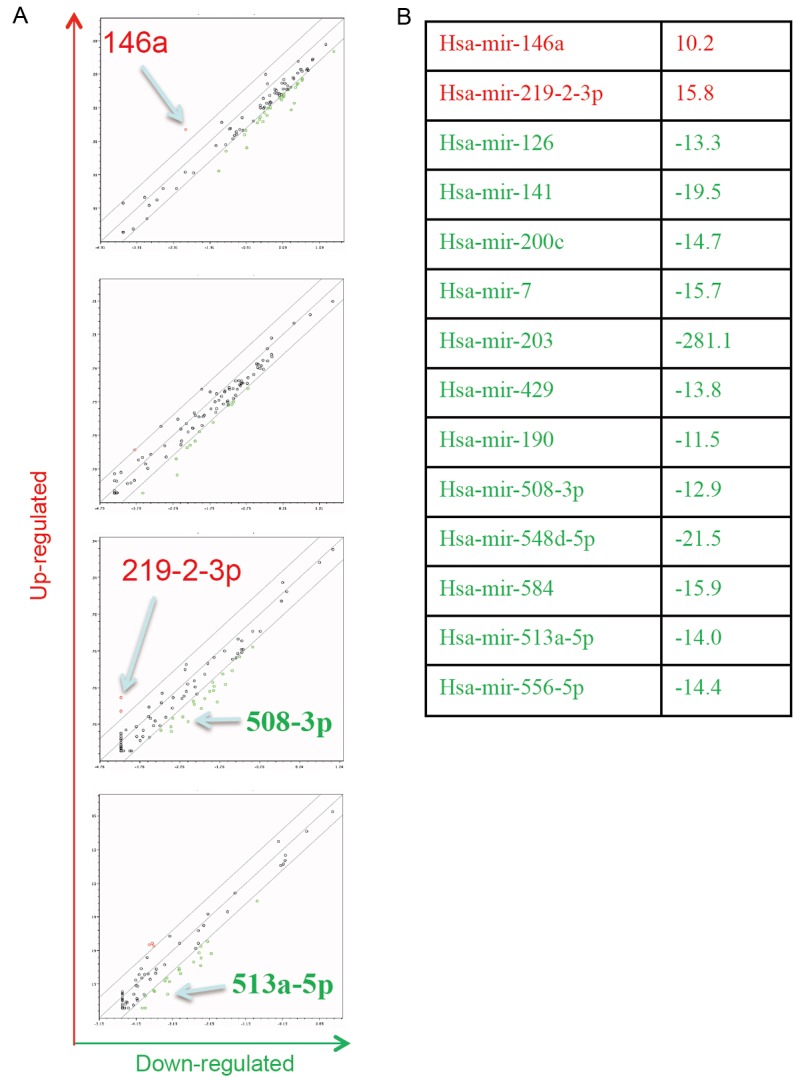
MicroRNA profile in 10A-iK8 cells. A: The whole genomic miR PCR array (consisting of 4 consecutive sets) was screened for KLF8-regulated miRs in the 10A-iK8 induced cells compared to the uninduced cells. Assay and analysis were described in the Materials and Methods. B: Shown are miRs whose expression levels were increased or decreased by > 10 times in the induced cells compared to the uninduced cells.